
Our view
This FOMC meeting is best read as a mildly dovish pause, still some distance from a genuine easing pivot. After a 25 bp increase in September, the October 28 decision held the target range at 3.75%-4.00%. Our central interpretation is that the pace of tightening has slowed, but the preference to tighten has not fully disappeared.[1][2]
Author: Taiyang Feng
Report ID: RI-RN-2026-003 · v1.0
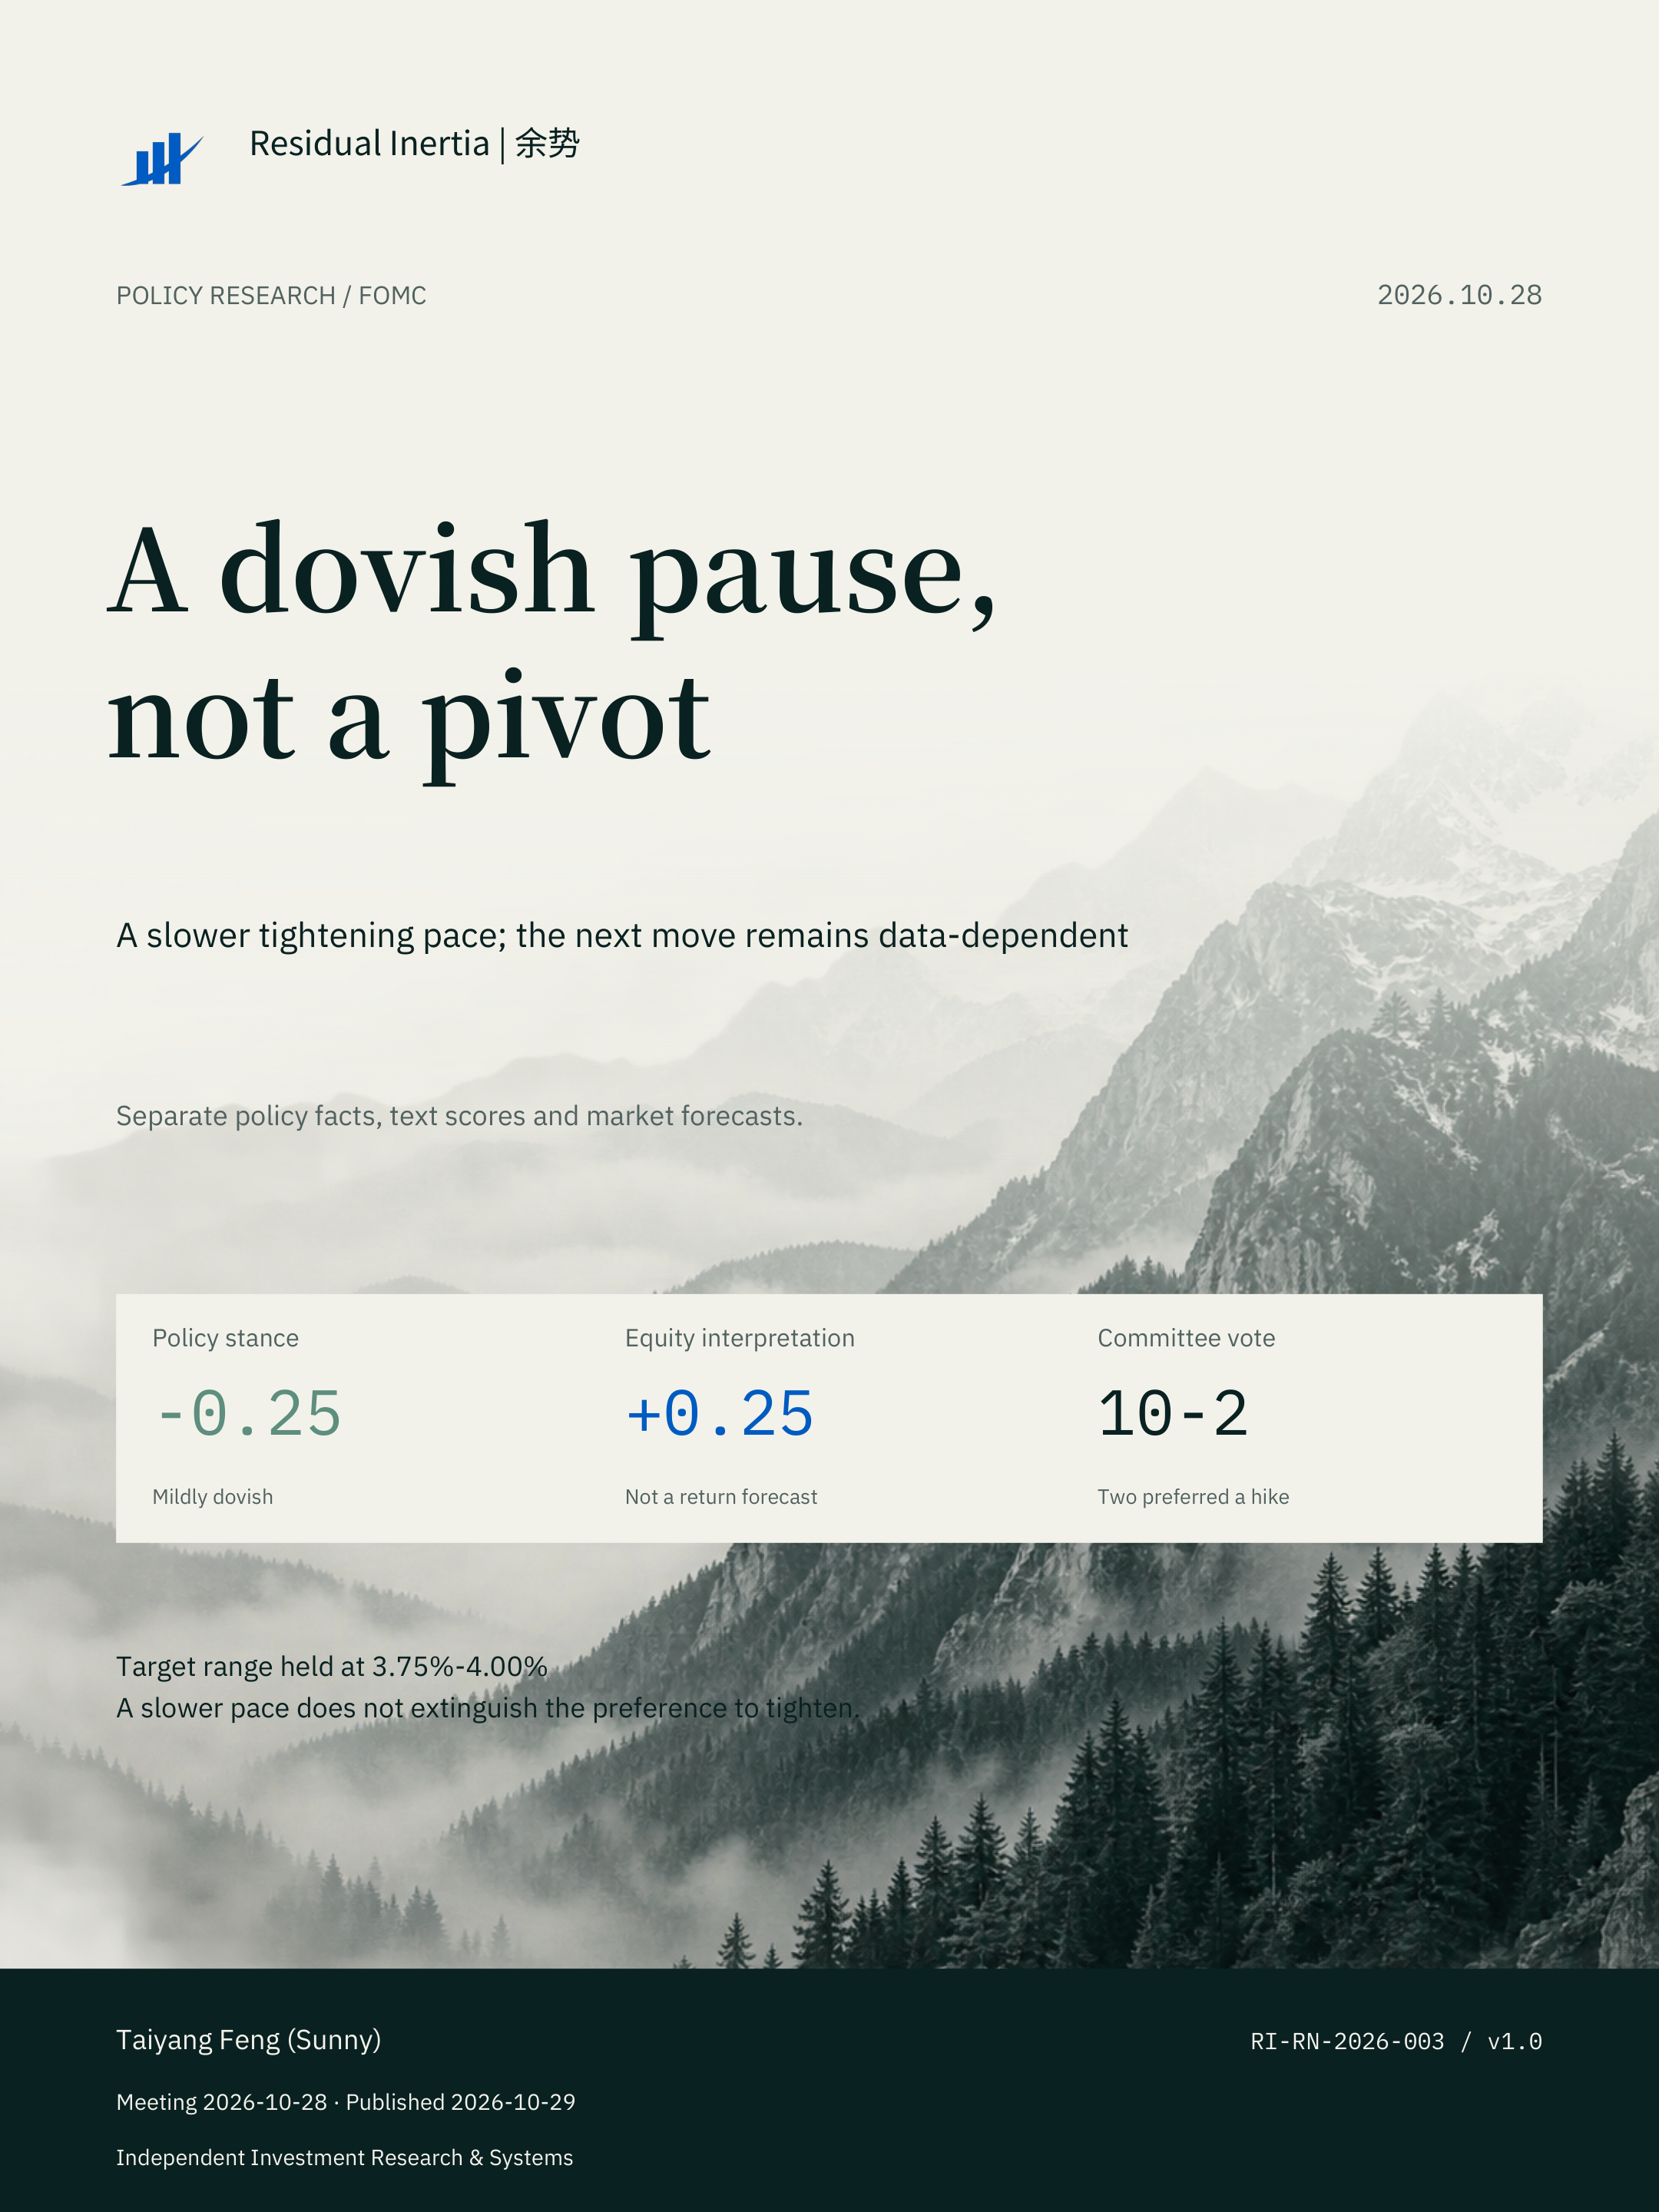
A dovish pause, not a policy pivot
This FOMC meeting is best read as a mildly dovish pause, still some distance from a genuine easing pivot. After a 25 bp increase in September, the October 28 decision held the target range at 3.75%-4.00%. Our central interpretation is that the pace of tightening has slowed, but the preference to tighten has not fully disappeared.[1][2]
A pause means no further rate increase at this meeting, not a commitment to cut. A stronger assessment of activity and two preferences for another hike constrain an overly dovish reading. Waiting for information preserves policy optionality rather than predetermining the direction.[1]
The RI policy-stance score is -0.25 and the equity-impact interpretation +0.25, consistent with a modestly friendlier marginal message. This report separates policy facts, the author's interpretation and model outputs. Near-term support is a conditional assessment, not an attribution of realized market moves or a return forecast.[3]
From policy action to gathering information
The September statement linked the action taken at that meeting to a more timely return of inflation to 2%. October instead made the accumulation of information the basis for determining an appropriate stance. The emphasis shifts from explaining an action already taken to choosing policy as information arrives. This does not imply that the Fed previously ignored data.[1][2]
Activity language also strengthened from solid to strong, while inflation was still characterized as elevated. The statement neither clearly conceded a weakening economy nor declared the inflation task complete. Observing the effects of prior tightening is the author's interpretation of this combination, not the Committee's uniquely stated rationale.[1][2]
The dashboard records one added sentence, no deletions and four modifications, with 92.6% text similarity and change intensity around 0.45. Similarity measures textual proximity rather than economic importance: a few changed sentences can carry more information than a large amount of unchanged wording.[3]
Historical context: mildly dovish, not extreme
Positive policy-stance scores are hawkish and negative scores dovish. A score of -0.25 ranks at the 34.3rd percentile of all scored meetings and the 32.9th percentile of the trailing five-year sample: below the middle, but not an extreme dovish observation. A higher percentile means relatively more hawkish language, not a higher quantified probability of a future hike.[3]
The database contains 233 statements and 232 scored meetings; 41 scored meetings fall within the five years ending at this meeting. Percentiles use a midrank: the count below the current score plus half the tied count, divided by the sample size. Both the sample size and comparison window affect the result.[3]
The topic chart assigns +0.25 to growth and -0.25 to forward guidance, with zero marginal scores for inflation, labor, the balance sheet and risk balance. Zero denotes no directional change assigned to that dimension, not the absence of an economic issue. The topic values should not simply be summed to reconstruct the overall -0.25; the holistic assessment also considers the policy action and dissents.[3]
The +0.25 equity-impact interpretation is a dimensionless research score, not an expected 0.25% gain or a policy-rate change. It organizes statement information; stable predictive value must be evaluated separately.[3][4]
The limits of the pause and the next meeting
Lisa D. Cook and Beth M. Hammack preferred another 25 bp increase in the 10-2 vote. The pause commanded majority support, but preferences for further tightening remain. The dissent demonstrates differing judgments; two votes alone do not determine the next decision.[1]
The potentially supportive combination for risk assets is no additional hike alongside an activity assessment that has not turned recessionary. Its significance still depends on pricing. Without verified pre-meeting expectations and a high-frequency price window, this report does not label the pause an unexpected positive shock or attribute a stock-market return to the meeting.
If growth remains resilient and disinflation stalls, renewed tightening remains a scenario to monitor. Sustained disinflation with stable employment would make a longer hold more plausible; a clear deterioration in activity and employment could shift discussion toward easing. These are conditional paths without unmeasured probability assignments.
The next scheduled meeting is December 8-9 and includes an SEP. The dashboard's current dot plot still dates from September 16, not a new October forecast. CME FedWatch is not connected, so this report supplies no hold, hike or cut probabilities and does not treat historical surveys as live expectations.[3][5]
Validation: interpretation, not an exposure signal
The primary historical validation sample contains 225 evaluable events from June 30, 1999 to December 10, 2025, with market data ending in 2025. It does not include this meeting's subsequent five-day performance and is not a completed validation of the October 28 observation.[4]
In the five-day value-weighted return regression, a one-unit increase in the equity interpretation score has a coefficient of +0.604 percentage points, with p=0.299, above the conventional 5% significance threshold. Before 2020, the coefficient is +1.624 pp with p=0.015; after 2020 it is -1.092 pp with p=0.279. The unstable sign argues against selecting the earlier significant result as proof of reliability.[4]
After adding the weekly risk variable, the score coefficient is -0.256 pp with p=0.640 across 160 events. Clear incremental explanatory evidence is absent. A p-value is not the probability of a profitable strategy, and these regressions do not causally identify the return effect of policy language.[4]
The dashboard conclusion is therefore retained: event interpretation and shadow monitoring only, with no integration into the composite risk score, target exposure or trading alerts. The policy reading can inform research, but +0.25 should not automatically raise equity exposure.[4]
Methods, information boundaries and disclosure
The meeting date is October 28, 2026 in U.S. Eastern time. The statement was released at 14:00 EDT, or 02:00 Beijing time on October 29. Prepared October 29; research ID RI-RN-2026-003; author Taiyang Feng (Sunny). The September and October official statements were checked. Model readings come from the dashboard export and supplied screenshots; no rescoring or database changes were performed.[1][2][3]
The policy-text scope is the statement. Press-conference material, unused minutes, realized post-meeting prices and unconnected futures probabilities are not added as evidence. Full-history percentiles describe the current score database; they do not establish real-time historical availability. Text scores and topic classifications involve interpretation, and model or sample revisions may affect results.
Tables retain displayed precision. The -0.25 and +0.25 values are scores; 34.3% and 32.9% are sample percentiles; 3.75%-4.00% is the policy-rate range; validation coefficients are in percentage points. These units are not interchangeable. Cover imagery is RI branding rather than data.
Prepared by Residual Inertia | 余势 for independent research and information, not investment or securities-trading advice. Scenarios are not forecasting commitments, and historical regressions do not guarantee future effectiveness. Both language editions share the research ID, data, charts and conclusions.
Sources
- [1] [October FOMC statement](https://www.federalreserve.gov/newsevents/pressreleases/monetary20261028a.htm)
- [2] [September FOMC statement](https://www.federalreserve.gov/newsevents/pressreleases/monetary20260916a.htm)
- [3] [Frozen scores and text metrics](https://residualinertia.com/assets/papers/ri-fomc-2026-10-28-data.json)
- [4] [Historical validation and sample boundaries](https://residualinertia.com/assets/papers/ri-fomc-2026-10-28-data.json)
- [5] [Official FOMC meeting calendar](https://www.federalreserve.gov/monetarypolicy/fomccalendars.htm)
Sources & Limitations
Official statements and frozen dashboard readings. Predictive validation is historical research through 2025 and excludes post-meeting returns for this event.
- [1] October FOMC statement
- [2] September FOMC statement
- [3] Frozen scores and text metrics
- [4] Historical validation and sample boundaries
- [5] Official FOMC meeting calendar
For research purposes only. Not investment advice. Past performance does not guarantee future results.