
Our view
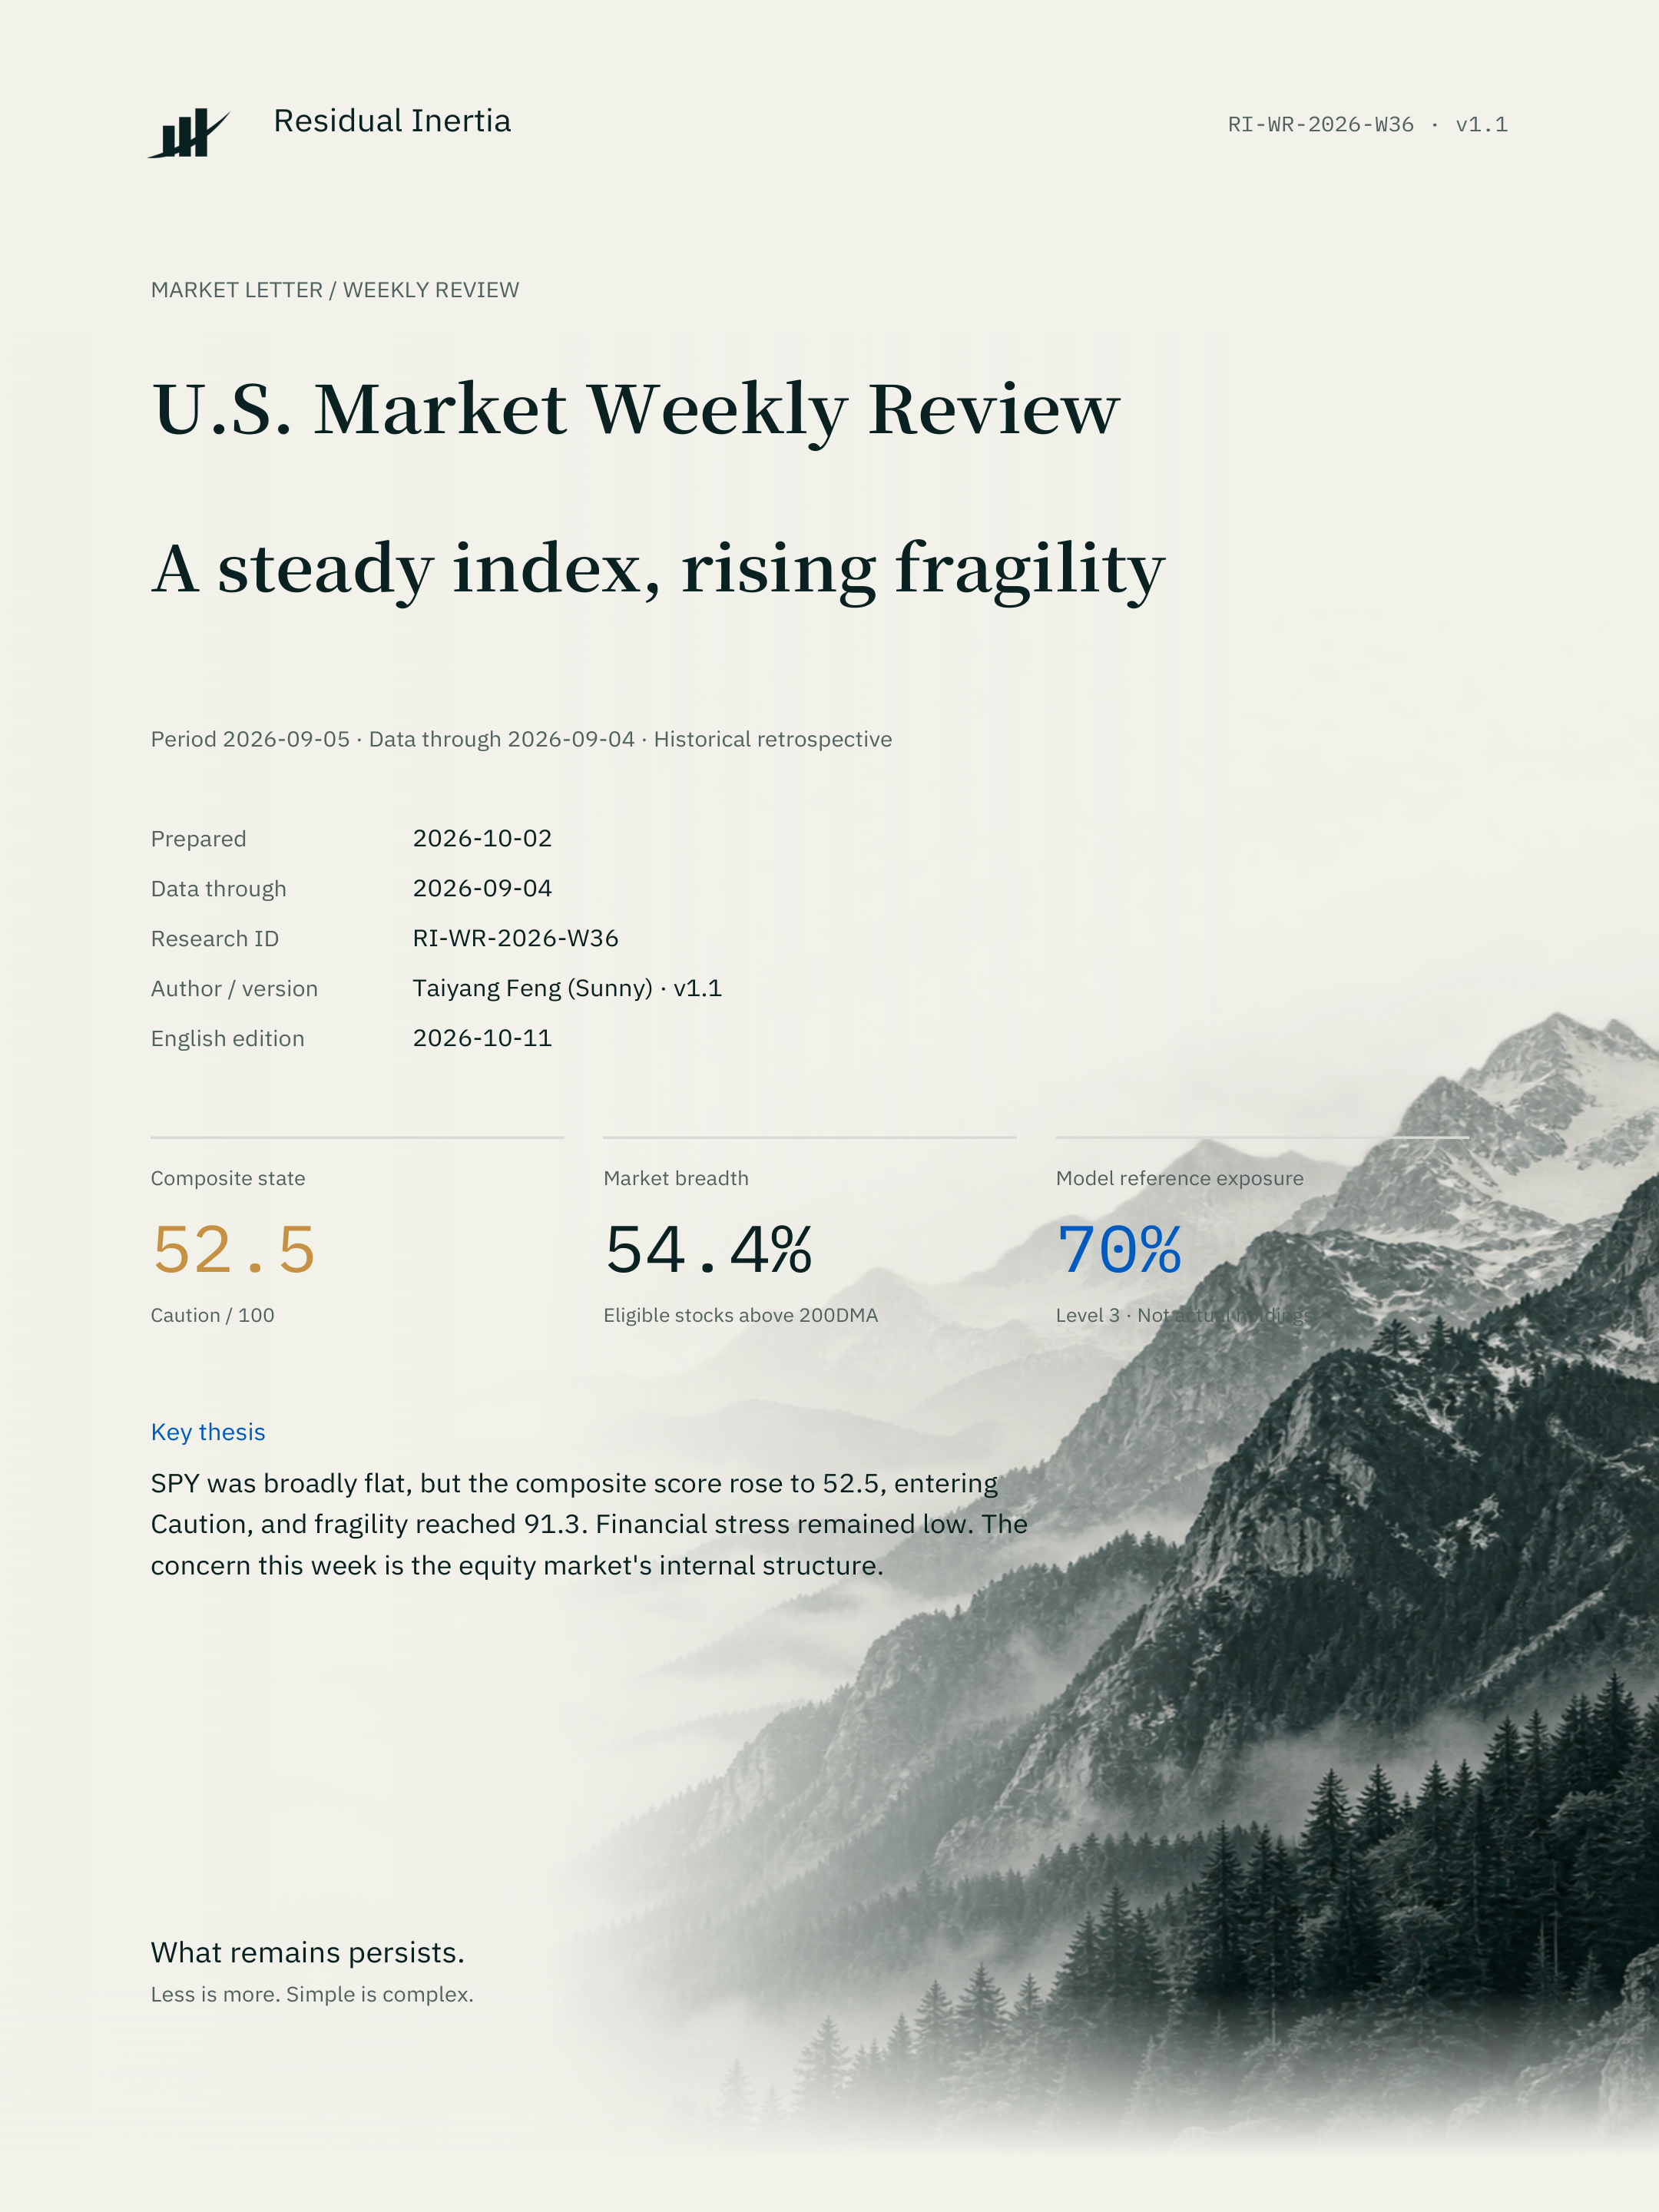
SPY was broadly flat, but the composite score rose to 52.5, entering Caution, and fragility reached 91.3. Financial stress remained low. The concern this week is the equity market's internal structure.
Author: Taiyang Feng
Report ID: RI-WR-2026-W36 · v1.1
This week in markets
| Measure | Previous | Current | Change |
|---|---|---|---|
| Composite score | 47.16 | 52.48 | +5.32 points |
| Market breadth | 54.81% | 54.40% | -0.41 pp |
| Financial stress | 25.42 | 34.10 | +8.68 points |
| Fragility | 83.56 | 91.32 | +7.76 points |
| Market risk | 55.53 | 46.24 | -9.29 points |
| Participation risk | 24.12 | 38.25 | +14.13 points |
Weekly model: Level 3, 70% reference risk exposure; signal date 2026-08-28. Composite and breadth observations end 2026-09-04.[1]
As of September 4, SPY rose 0.11% from the preceding week. The proportion of eligible stocks above their 200-day moving averages was 54.40%, down 0.41 percentage points. The index stabilized and breadth did not contract sharply, but the spread of gains did not improve.[1][2]
The composite score rose from 47.2 to 52.5 and fragility increased from 83.6 to 91.3, the clearest changes this week. Market risk fell to 46.2, while participation risk increased to 38.2. The indicators did not move in one direction: index stabilization did not establish a comprehensive structural recovery.[1]
Steady employment still constrains the case for easing
U.S. nonfarm payrolls increased by 162,000 in August, the unemployment rate remained 4.1%, and average hourly earnings grew 3.1% year over year. Employment did not weaken materially; the economy remained resilient.[3] The July FOMC held the target range at 3.50%-3.75%, with three members preferring an increase. In that context, slower employment alone provides insufficient grounds to expect easier policy.[4]
Financial stress was 34.1, still in the Constructive range. Current risk is concentrated inside the equity market rather than in widespread financing stress. The allocation interpretation remains cautious: index stability is worth monitoring, but confirmation requires improving trends across more stocks. The archived weekly model remained Level 3 with a 70% reference risk exposure. Its signal dates to August 28 and must not be described as a new signal for this week.
What to watch
| Area | Observation |
|---|---|
| Market breadth | Watch whether the proportion above the 200-day moving average recovers, rather than the index alone stabilizing. |
| Structural risk | Track fragility and participation risk, particularly whether elevated readings decline. |
| Policy constraints | Monitor the next inflation release and policy developments ahead of the September meeting. |
Data and methodology
Observation window: 2026-08-28 to 2026-09-04. Model readings use the archived vintage for that period. SPY prices use records frozen on October 2, 2026.[1][2]
Breadth is the proportion of eligible U.S. equities trading above their 200-day moving averages. Coverage varies; this is not S&P 500-only breadth. Historical denominators were not fully preserved.
Weekly SPY price changes use adjusted closes. Dividend reinvestment was not independently reconstructed; these changes are not strategy returns.[2]
Composite states use the unrounded score: below 35 Constructive; 35 to below 50 Neutral; 50 to below 65 Caution; 65 to below 80 Defensive; 80 or above Stress. Lower-frequency components and weekly signals can lag. Scores are not crisis probabilities.
This is a retrospective prepared on October 2, 2026, not a publication made during the historical week. Version 1.1 revised commentary while retaining the original data vintage. Screenshots and subsequently recalculated histories may differ.
Limitations
This report focuses on internal U.S. equity-market structure and uses SPY as an index price proxy. It does not perform event-level causal analysis or incorporate releases after the observation cutoff.
Archived quality checks passed; the source freshness label was stale. Signal dates are stated separately. Passing quality checks does not mean that all inputs have been updated.
Disclosure
Prepared by Residual Inertia | 余势 for research and information only. This is not investment or securities-trading advice. Model outputs do not represent actual account holdings. The report does not disclose the author's holdings or conflicts of interest.
Sources & Limitations
Sources: archived model readings, frozen SPY price records and the official releases listed in the report.
- [1] RI archived market snapshot
- [2] Massive SPY price data methodology
- [3] August employment report
- [4] July FOMC statement
For research purposes only. Not investment advice. Past performance does not guarantee future results.