
Our view
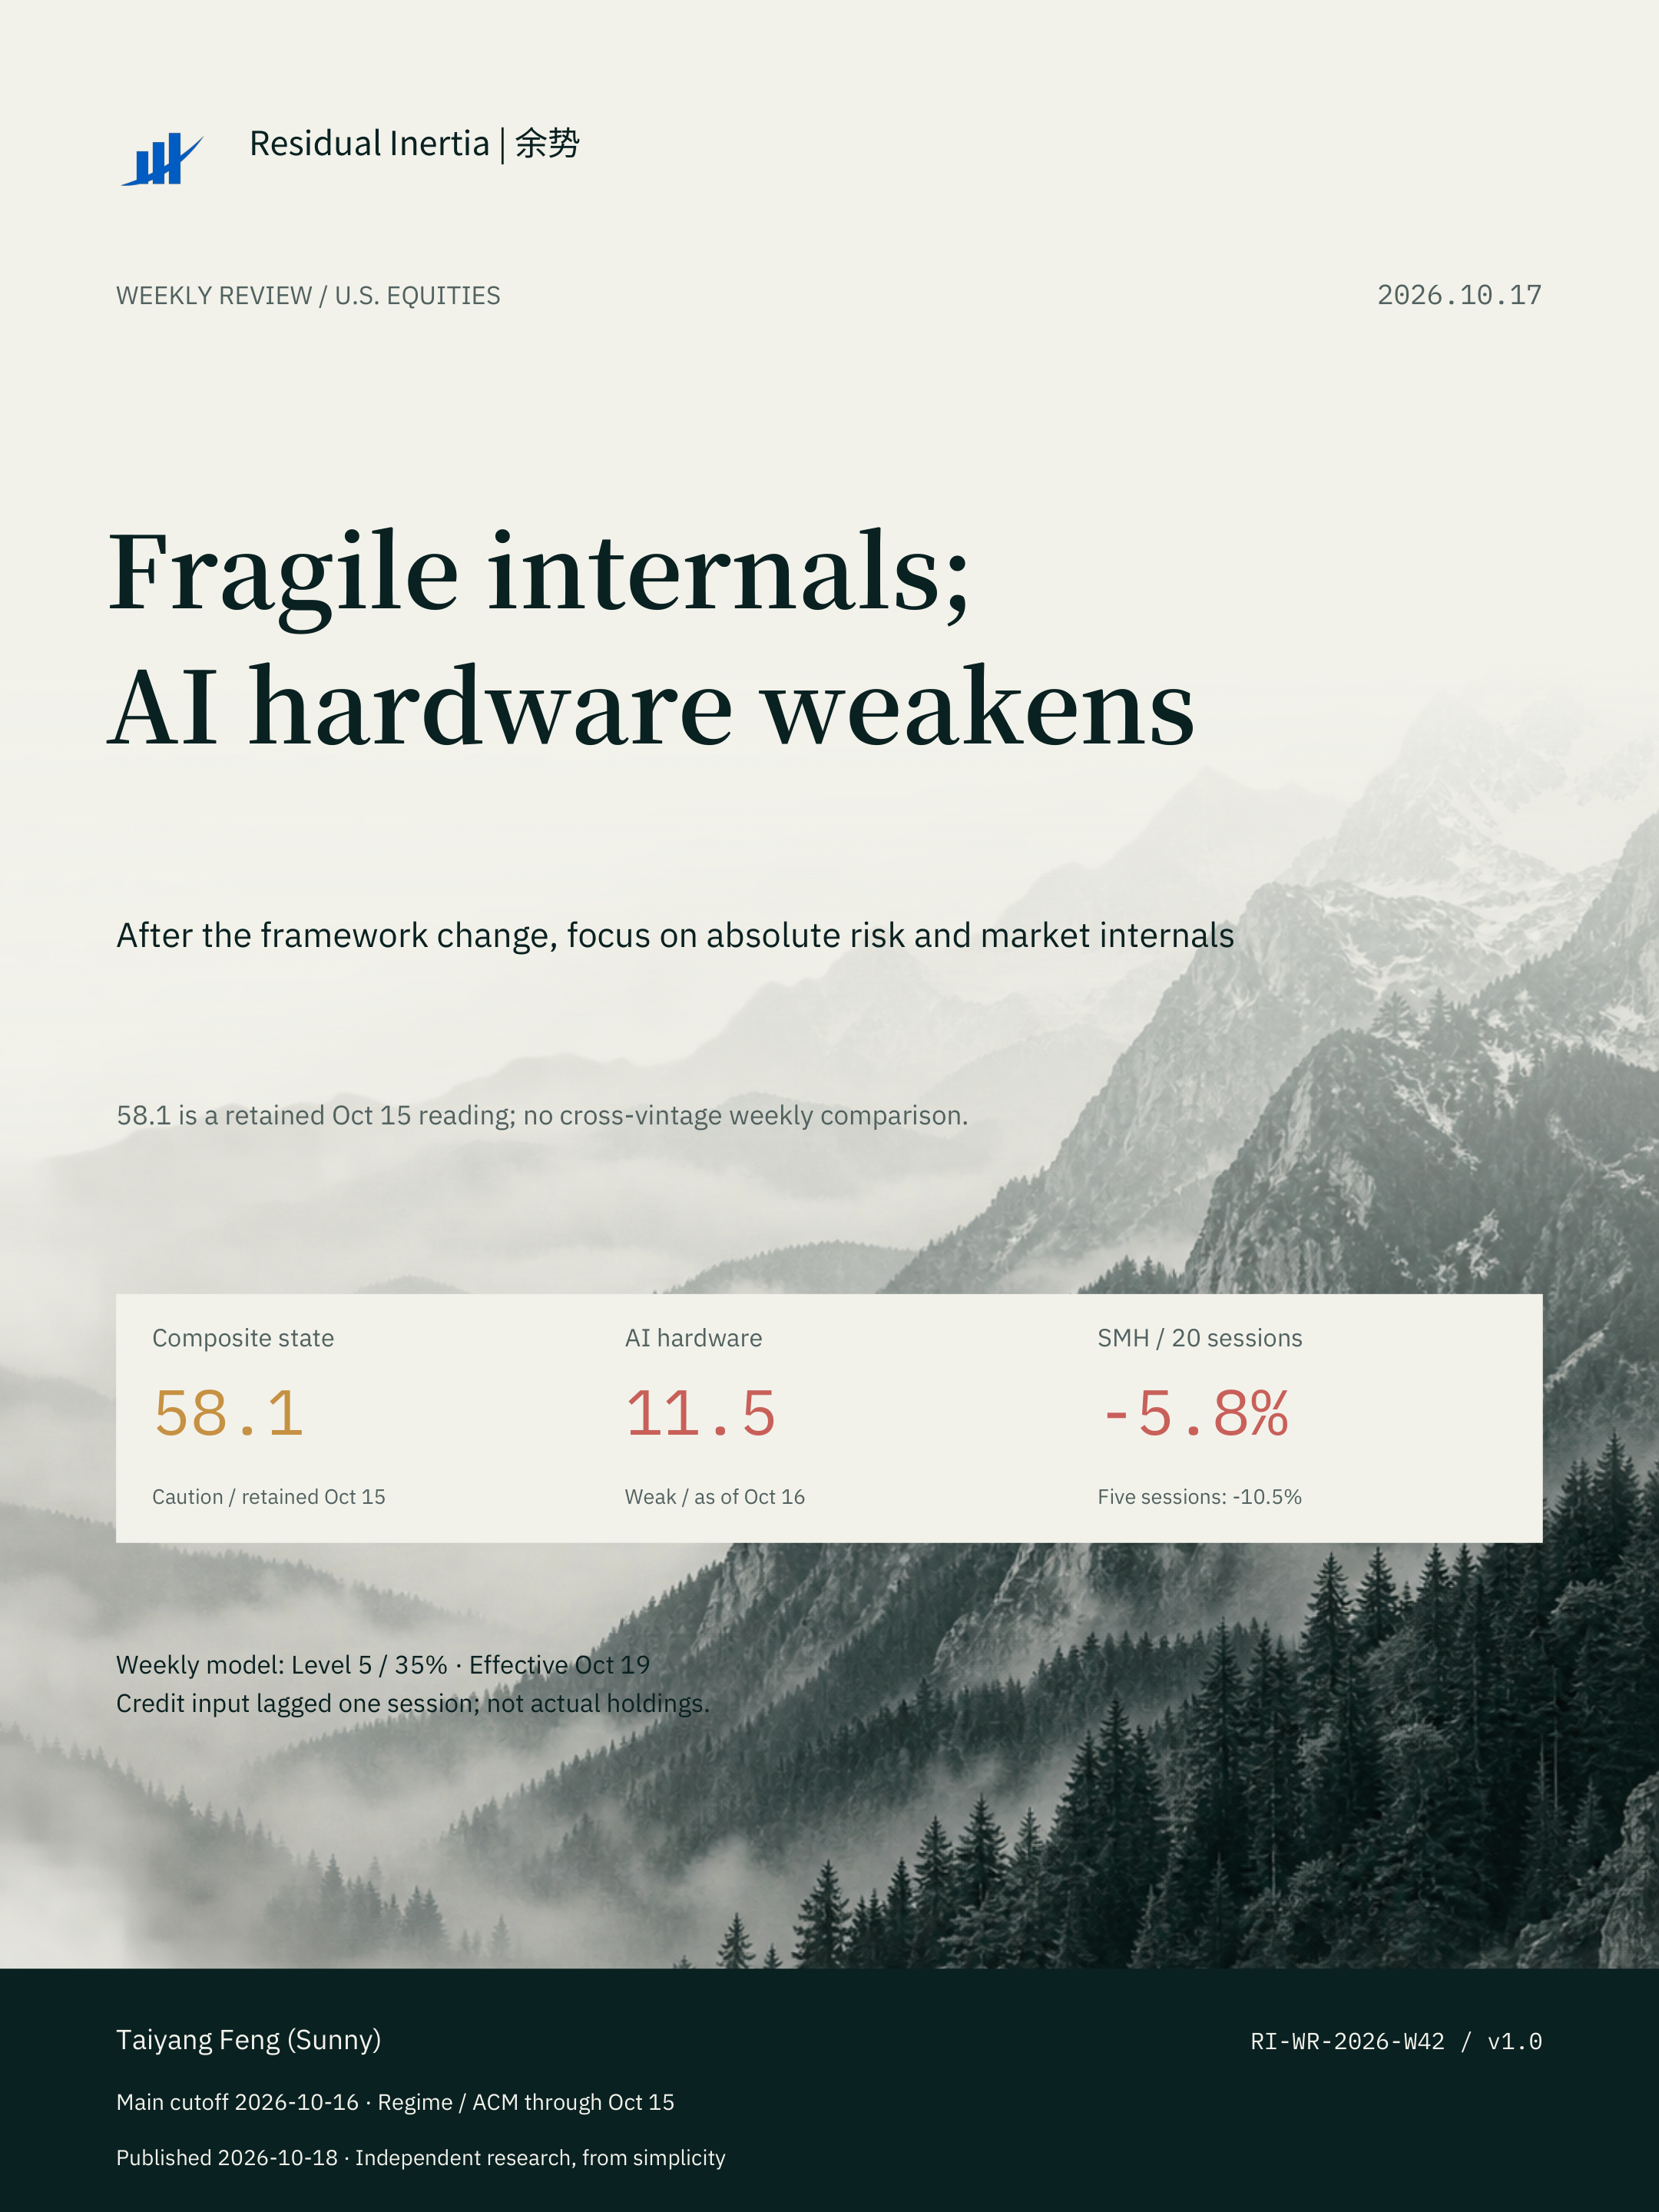
The retained October 15 composite reading is 58.1 / Caution and is not directly comparable with last week. Fragility remains 93.3, AI hardware is 11.5 / Weak, and SMH lost 5.8% over 20 trading days. The weekly model is Level 5 / 35%, using credit input lagged one session and effective October 19. The research stance remains defensive and evidence-led.
Author: Taiyang Feng
Report ID: RI-WR-2026-W42 · v1.0
A new score does not establish an all-clear
This review uses October 16 as its main observation cutoff. The latest retained composite is 58.1 / Caution, dated October 15 and still marked PENDING_SOURCE. The framework and source transition changed this week. Subtracting 58.1 from last week's 65.8 would mix vintages and cannot establish a material decline in market risk.[1]
Within the retained snapshot, Market Risk is 55.5 and Participation risk 56.8, both Caution. Financial Stress is 26.9 / Constructive, while Fragility remains 93.3 / Stress. The risks are uneven rather than uniformly systemic, but internal pressure has not disappeared. Monthly composite breadth is about 40%; a lower headline score alone is insufficient evidence of a healthy market.[1]
Semiconductors and AI hardware offer more direct evidence of weakness: the composite is 11.5 / Weak, demand momentum is near zero, and SMH fell 10.53% over five sessions and 5.80% over 20. The research stance remains defensive, pending joint confirmation from participation, trends and input completeness. Model reference exposure is not the author's or any account's actual holdings.[1]
Separate the retained reading from the model revision
58.1 combines the four displayed pillars under this vintage; it is not a crisis probability. The gap between Fragility at 93.3 and Financial Stress at 26.9 shows that structural pressure and financial conditions do not send equally strong signals. Caution still calls for attention to participation, concentration and correlated adjustment, rather than treating a state label as a trading instruction.[1]
The page explicitly dates the composite to October 15 and labels the update COMPLETED_WITH_SOURCE_GAP / PENDING_SOURCE. The factor-source migration has not fully cleared its publication gate, so existing composite and related displays are retained. This report preserves those observation dates and statuses; neither screenshot creation nor task completion is substituted for a data date.[1]
Accordingly, this edition draws no cross-vintage weekly comparison line and calculates no week-on-week reduction in risk. Testing improvement requires a comparable series under one published methodology, followed by joint checks of participation, fragility and credit inputs. The retained legacy weighted value of 57.2 is also distinct from the official displayed 58.1.[1]
Breadth, financial conditions and factor definitions
The roughly 40% homepage breadth reading is the mean of two September 30 monthly measures: 43.51% above the 200-day average and 36.52% outperforming the benchmark over 12 months, averaging 40.02%. The separate October 16 daily 200DMA estimate is 41.72%, or 1,395 of 3,344 eligible observations. These differ in frequency and definition.[1]
NFCI and ANFCI are dated October 9, at -0.499 and -0.485, a difference of -0.014. Negative levels are consistent with relatively loose financial conditions, but their four-week increases of 0.037 and 0.068 warrant attention to the direction of change. A low Financial Stress pillar neither removes the credit-input gap nor proves that every liquidity channel is free of pressure.[1][4]
Long-short crowding excluding the market factor is 0.758 / L3; beta-adjusted long-only crowding is 0.872 / L4. Both are end-August observations. In the separate valuation layer, HML is near its 98.8th percentile, displayed as 99%: higher means value is relatively cheaper, not 99% crowded. UMD's 25.7th percentile has the opposite direction. These remain retained displays during the source migration, rather than newly validated factor releases this week.[1]
AI hardware loses both trend support and participation
As of October 16, the semiconductor and AI hardware composite is 11.5 / Weak. Demand momentum is about 0.5, rounded to 0 on the dashboard; leadership breadth is 8.9, supply-chain confirmation 8.3 and relative risk appetite 30.5. Lower scores mean weaker trend support in this model, unlike the higher-is-riskier direction of the broad-market regime score.[1]
None of the 28 monitored stocks is above its 20-day moving average, and only two are above the 50-day average, or 7.1%. This is not 200DMA breadth. The proportion with positive 20-day returns is 17.9%. Weakness appears in short- and medium-term participation and in most constituent price changes, not just the composite score.[1]
Sector crowding / heat has cooled to 29.8 / Cool, while divergence fragility is still 73.5 / Elevated. Cooling does not establish trend repair: with weak demand, leadership and supply-chain confirmation, lower heat can coexist with falling prices. A more constructive view requires more stocks to regain moving averages and joint improvement in relative performance and several research pillars.[1]
Relative semiconductor strength has also weakened
SMH lost 5.80% over 20 sessions, trailing SPY by 6.00 percentage points and QQQ by 4.18 points; its five-day loss was 10.53%. Over the same 20-day window SPY gained 0.20% and QQQ lost 1.61%. Sector pressure therefore includes both an absolute drawdown and underperformance relative to broad benchmarks.[1]
All five monitored industry groups have negative mean 20-day price changes: Analog / MCU / Power -0.97%, Foundry & Equipment -6.42%, AI Accelerators -8.27%, Servers & Networking -17.34%, and Memory & Storage -21.28%. These are simple means within the monitored groups, not investable portfolio returns or capitalization-weighted industry performance.[1]
A few relatively resilient stocks do not establish broad leadership repair. ADI, TXN and ON lead the 20-day ranking while COHR, STX and WDC lag, yet every monitored stock remains below its 20-day average. Participation diffusion, relative trends and supply-chain confirmation matter more than inferring a broad recovery from a few resilient names.[1]
Rates ease over the week but remain a medium-term constraint
The New York Fed ACM ten-year fitted yield is 5.075% as of October 15, comprising a 4.327% expected average short-rate component and a 0.747% term premium. Their sum is the fitted yield, not a traded Treasury quote; it does not directly forecast the next policy decision.[1][3]
From September 15 to October 15, the fitted yield rose 10.01 bp: expected rates contributed 5.79 bp and term premium 4.22 bp. Three-, six- and twelve-month increases remain 47.00, 75.23 and 97.32 bp, respectively, with the expected-rate component larger in each window.[1][3]
Within the same current dataset, the fitted yield fell 14.21 bp from October 8 to 15: expected rates rose 3.02 bp while term premium fell 17.23 bp. Weekly relief and a positive one-month change can coexist. These comparisons use one vintage and explicit endpoints; differences from last week's published vintage are not misidentified as market moves.[1]
A defensive stance pending joint confirmation
The weekly risk signal is dated October 16: Level 5, with 35% model reference exposure and an October 19 effective date. CURRENT_WITH_LAGGED_INPUTS means it is a current usable signal under the configured lag policy, rather than a retained prior-week signal; it is not an all-inputs-complete result.[1]
The high-yield spread input BAMLH0A0HYM2 only reaches October 15, one trading session short of the target cutoff. Its publication state is a normal wait. This edition invents no October 16 credit observation and makes no advance claim about how completion will affect the level. Once the official observation arrives, exposure, credit direction and the other risk pillars require another check.[1][5]
Keep the validation order clear: first verify the source and methodology transition, then broad participation and fragility, and then AI hardware moving-average breadth, relative performance, demand and supply-chain confirmation. Rate relief is a separate clue and does not alone offset structural pressure. The screenshot's Livermore S2 reading is 40.4 / Normal; it is not a direct systemic-liquidity measure.[1]
Data, methodology and disclosure
The observation cutoff is October 16, 2026; the review period is October 17, and both editions were prepared and first published October 18. Inputs are frozen without model updates or re-estimation. Retained regime and valuation displays end October 15; equities and hardware end October 16; ACM October 15; NFCI / ANFCI October 9; monthly breadth September 30; factor crowding August 31.[1]
Broad risk and AI hardware use different models and score directions. Broad-risk ranges are below 35 Constructive, 35 to below 50 Neutral, 50 to below 65 Caution, 65 to below 80 Defensive, and 80 or above Stress. This edition retains displayed values, does not label the pending factor-source migration complete, and does not stitch different breadth definitions into one time series.[1]
Price changes use existing dashboard adjusted-price inputs, not independently reconstructed dividend-reinvested total returns. Hardware covers 28 monitored stocks; breadth eligibility and coverage depend on the definition. ACM is a model decomposition in percent, with changes in bp; 1 bp is 0.01 percentage points. The future-dated standalone WQS card is excluded as a realized observation. Cover mountains are brand imagery.[1][2][3]
Prepared by Residual Inertia, author Taiyang Feng (Sunny), for independent research and information sharing. This is not investment or securities-trading advice. Model reference exposure is not actual holdings. Historical performance, model states and scenarios do not guarantee future outcomes.
Report chart data
Four pillars / retained October 15 snapshot
| Pillar | Score | State |
|---|---|---|
| Financial Stress | 26.9 | Constructive |
| Fragility | 93.3 | Stress |
| Market Risk | 55.5 | Caution |
| Participation | 56.8 | Caution |
ETF adjusted-price changes through October 16
| ETF | Five sessions | Twenty sessions |
|---|---|---|
| QQQ | -5.52% | -1.61% |
| SMH | -10.53% | -5.80% |
| SOXQ | -11.41% | -6.63% |
| SOXX | -11.80% | -7.44% |
| SPY | -1.97% | +0.20% |
| XSD | -12.48% | -8.81% |
AI hardware pillars / October 16
| Pillar | Score | Direction |
|---|---|---|
| Composite | 11.5 | Higher = stronger support |
| Demand momentum | 0.5 | Higher = stronger support |
| Leadership breadth | 8.9 | Higher = stronger support |
| Relative risk appetite | 30.5 | Higher = stronger support |
| Supply-chain confirmation | 8.3 | Higher = stronger support |
| Crowding / heat | 29.8 | Higher = greater risk |
| Divergence fragility | 73.5 | Higher = greater risk |
Industry-group means / October 16
| Group | Stocks | Five sessions | Twenty sessions |
|---|---|---|---|
| Analog, MCU & Power | 8 | -5.32% | -0.97% |
| Foundry & Equipment | 7 | -13.01% | -6.42% |
| AI Accelerators | 5 | -12.08% | -8.27% |
| Servers & Networking | 5 | -23.23% | -17.34% |
| Memory & Storage | 3 | -16.47% | -21.28% |
ACM contributions / all windows end October 15
| Start | Expected bp | Premium bp | Total bp |
|---|---|---|---|
| 2026-09-15 | +5.79 | +4.22 | +10.01 |
| 2026-07-15 | +40.14 | +6.87 | +47.00 |
| 2026-04-15 | +65.22 | +10.01 | +75.23 |
| 2025-10-15 | +78.82 | +18.50 | +97.32 |
Sources
- [1] [Frozen report inputs and status notes](https://residualinertia.com/assets/papers/ri-weekly-2026-10-17-data.json)
- [2] [Massive adjusted-price methodology](https://massive.com/docs/rest/stocks/aggregates/custom-bars)
- [3] [New York Fed ACM Treasury Term Premia](https://www.newyorkfed.org/research/data_indicators/term-premia-tabs)
- [4] [Chicago Fed NFCI / ANFCI methodology](https://www.chicagofed.org/research/data/nfci/about)
- [5] [FRED high-yield spread input](https://fred.stlouisfed.org/series/BAMLH0A0HYM2)
Sources & Limitations
Frozen inputs and author-provided dashboard screenshots, preserving observation dates and pending-source statuses. HML at 99% is a valuation percentile, not crowding. Models were not re-estimated; private paths, task logs and account information are excluded.
- [1] Frozen report inputs and status notes
- [2] Massive adjusted-price methodology
- [3] New York Fed ACM Treasury Term Premia
- [4] Chicago Fed NFCI / ANFCI methodology
- [5] FRED high-yield spread input
For research purposes only. Not investment advice. Past performance does not guarantee future results.