
Our view
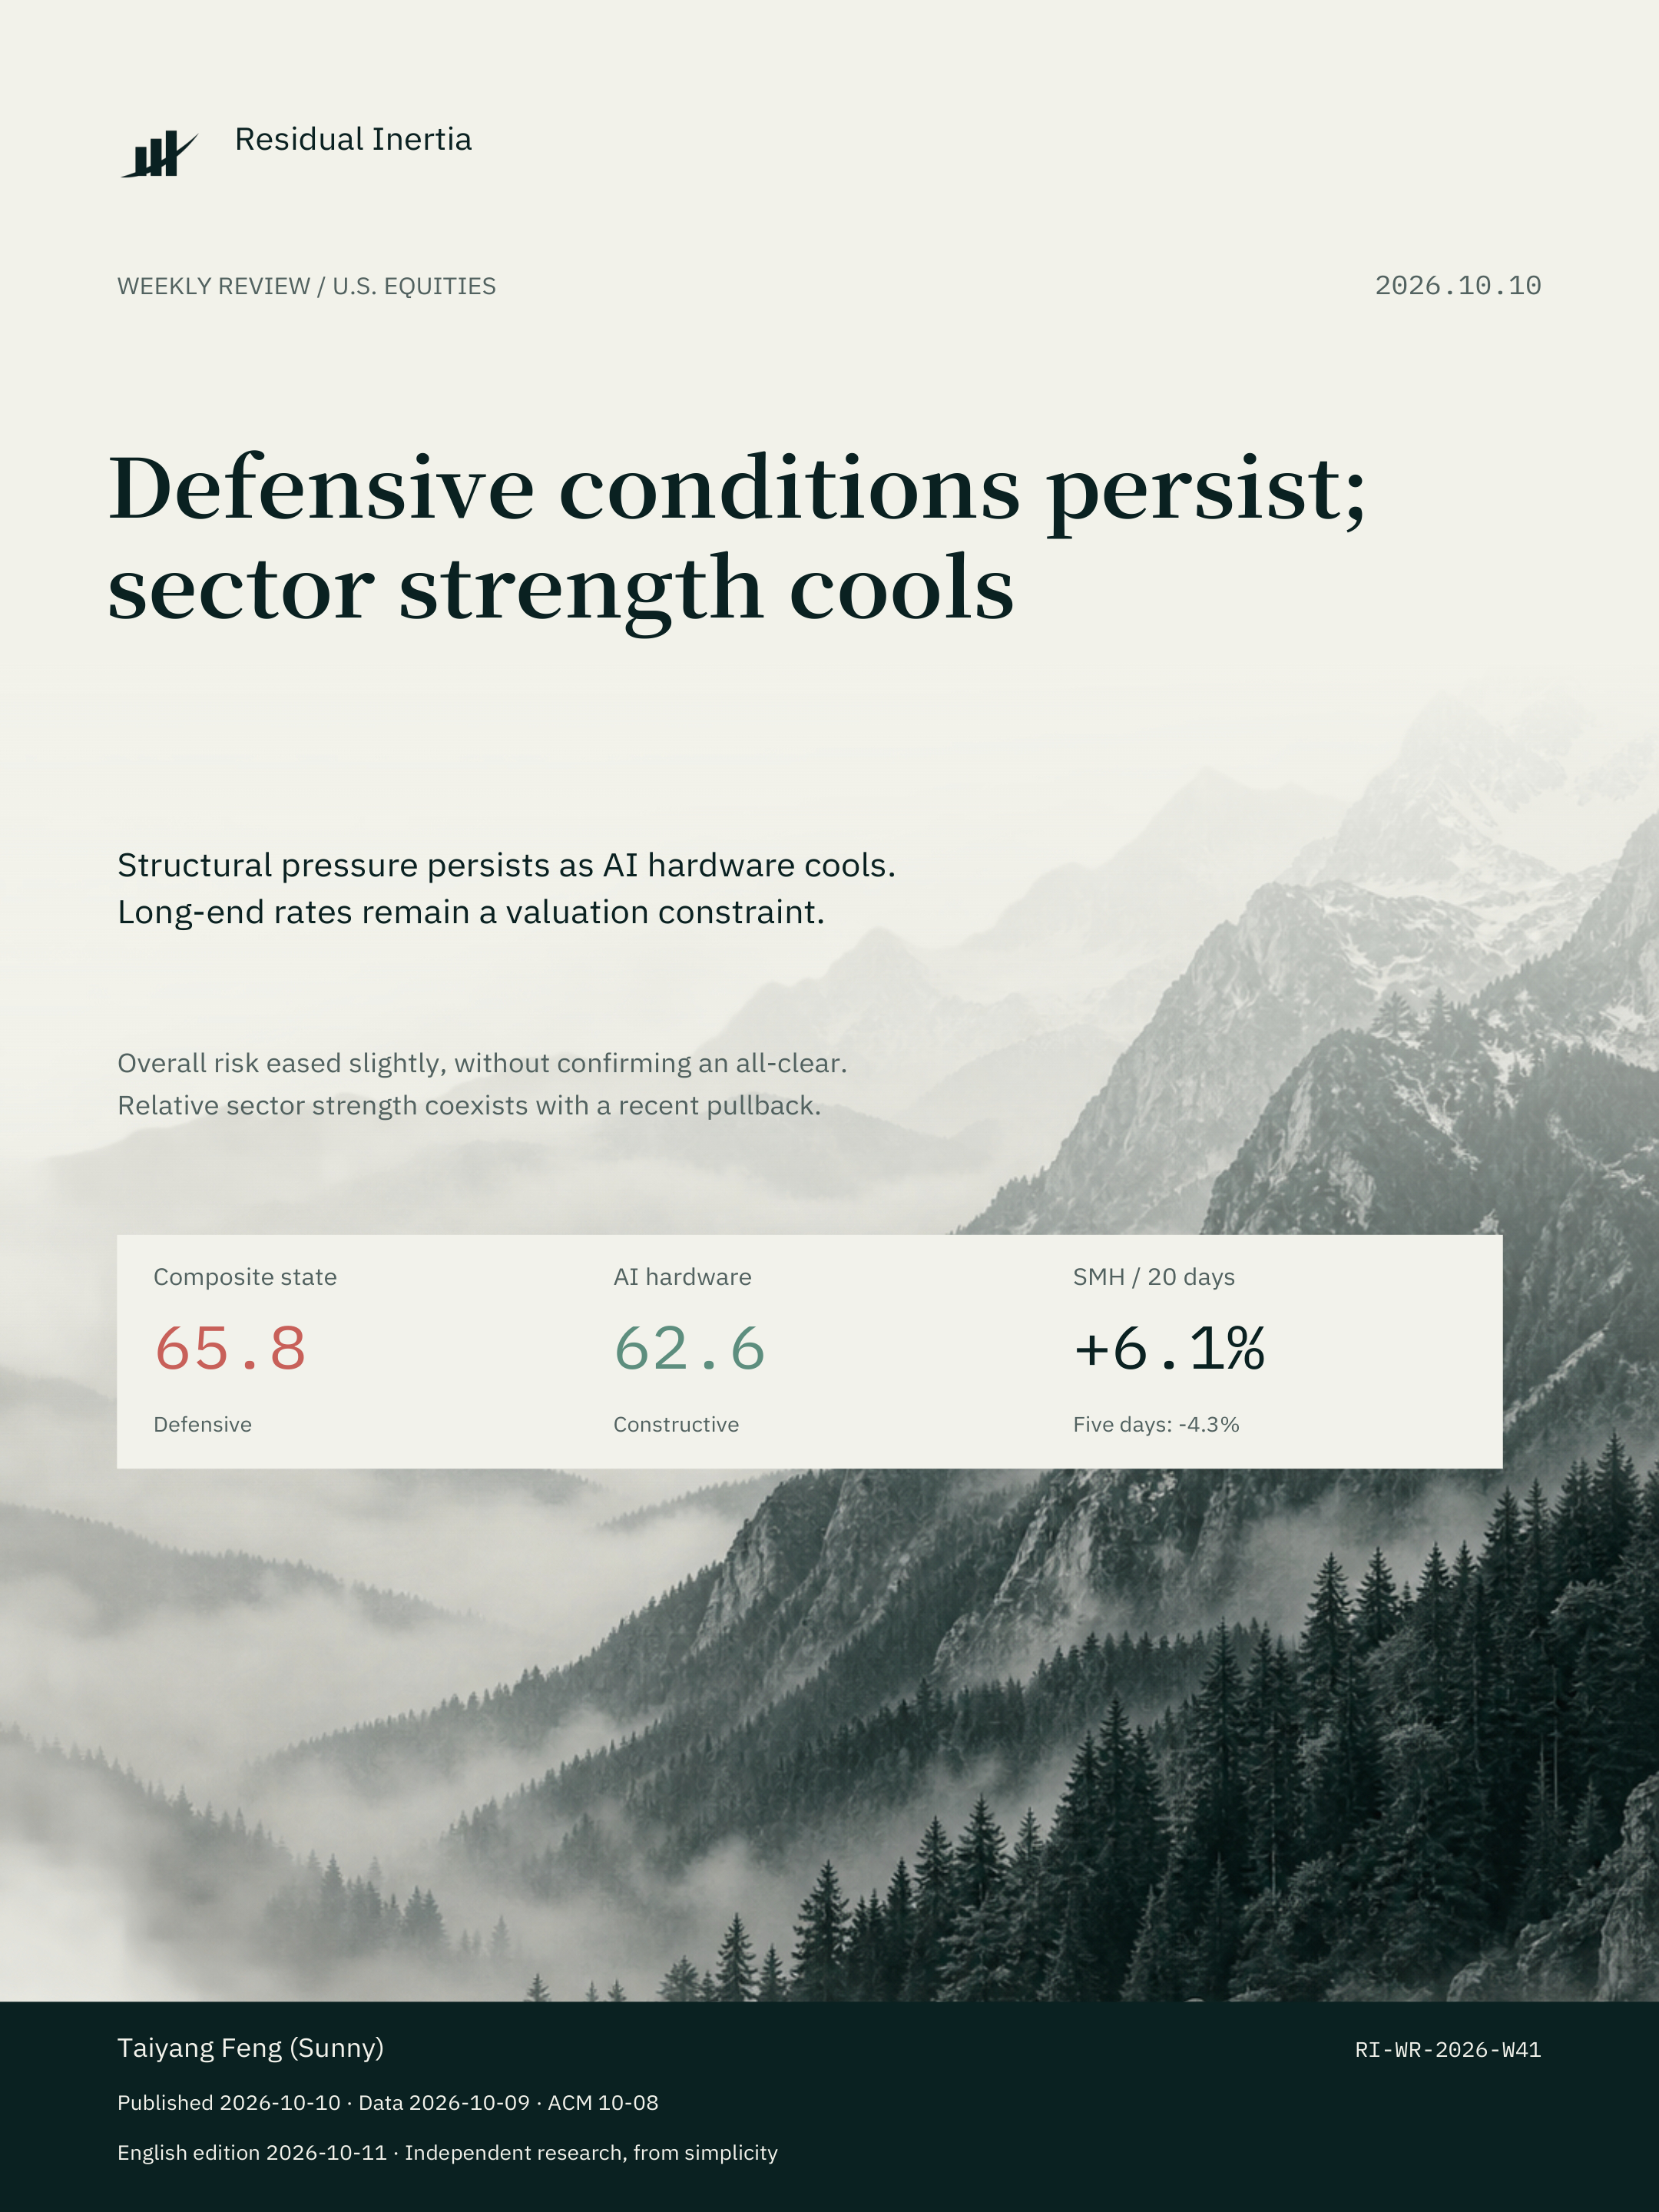
The October 9 composite score was 65.8, still Defensive. Participation risk and fragility remain elevated. AI hardware cooled to 62.6 (Constructive): SMH gained 6.12% over 20 days but fell 4.32% over five days. The weekly model retains its October 2 signal while current credit data remains incomplete.
Author: Taiyang Feng
Report ID: RI-WR-2026-W41 · v1.0
Risk eased slightly; the structure remains unresolved
As of October 9, the composite Market Regime score was 65.8, still Defensive. In the current data vintage, the October 2 score was 66.59 and the October 9 score was 65.84, a decline of 0.75 points. The reading improved slightly without leaving the Defensive range. This does not confirm that market risk has cleared.[1]
The main constraint remains internal structure. Participation risk at 74.8 and fragility at 94.1 are substantially higher than market risk at 54.5 and financial stress at 40.0. Persistent trends in selected assets do not establish broad participation across the market. Financial conditions have not produced the same intensity of pressure, while concentration and the potential for synchronized unwinds remain concerns.[1]
The AI hardware score declined from the previously published 91.5 to 62.6, changing from Strong to Constructive. SMH remained up 6.12% over 20 trading days but fell 4.32% over five days. Longer-window relative strength and recent cooling coexist; a positive 20-day return alone does not establish an unchanged short-term trend.[1]
The research interpretation remains selective rather than broadly aggressive. Participation, structural fragility, sector trends and rates should be considered together. The weekly model's Level 4 / 90% is a retained signal, not a completed new weekly reading. Reference exposure is not the author's or any account's actual allocation.[1]
Market structure: fragility remains the main constraint
Market risk at 54.5 is Caution and financial stress at 40.0 is Neutral. Participation is still Defensive, while fragility is in Stress. This resembles internal structural pressure without a comparable amplification of financial stress, rather than simultaneous deterioration in every risk source.[1]
The composite is the equal-weighted result of four pillars. Participation at 74.8 and fragility at 94.1 keep the overall score elevated even with lower readings in the other two pillars. Strength in selected indexes or sectors therefore does not automatically invalidate the broad-market risk assessment.[1]
During the week, same-vintage composite readings ranged from 65.48 to 67.15 and ended at 65.84. Even the low remained above the Defensive threshold of 65. These fluctuations are not state changes. Any future decline should be assessed alongside participation and fragility, not solely a temporary threshold crossing.[1]
The previous report retains its originally published October 2 reading of 66.82; the current recalculated history reports 66.59 for that date. Weekly comparisons here use one vintage so revisions are not treated as market improvement. The legacy weighted reading of 58.4 uses a different methodology and is not interchangeable with the current official reading of 65.8.[1]
Breadth and financial conditions require separate readings
The dashboard's approximately 37% breadth figure is not a single 200-day moving-average ratio. It is the simple mean of two September month-end measures: 41.47% above the 200-day average and 32.60% outperforming the SPY benchmark proxy over 12 months. Their mean is 37.04%, with an observation date of September 30.[1]
The October 9 daily 200DMA estimate is 41.83%, or 2,438 of 5,828 eligible observations. Its definition, date and denominator differ from the monthly composite, so this cannot be described as breadth rising from 37% to 42%. The regime's participation pillar combines the latest daily moving-average breadth with the September month-end 12-month outperform ratio.[1]
NFCI and ANFCI observations dated October 2 were -0.494 and -0.504, with a difference of 0.010. NFCI indicates conditions looser than their historical average; ANFCI indicates conditions looser than expected given the current economic environment. However, their four-week changes were +0.066 and +0.086, indicating tightening relative to earlier readings. A narrower gap does not by itself establish further overall easing.[1][4]
Factor crowding is version- and date-specific. The September month-end long-short variant excluding the market factor was 0.732 / L3. The August month-end beta-adjusted long-only variant was 0.872 / L4. Elevated readings in selected variants are consistent with fragility, but they are not new October 9 daily signals and do not establish that every factor became more crowded this week.[1]
Semiconductors and AI hardware: constructive, with a recent pullback
AI hardware scored 62.6, Constructive. Demand momentum at 76.9 and leadership breadth at 72.0 still provide support. Supply-chain confirmation at 58.8 and relative risk appetite at 57.6 do not show the same degree of broad reinforcement as the prior report. Constructive describes the model state, not a guarantee of subsequent gains.[1]
Of 28 monitored stocks, 20 were above their 20-day moving averages (71.4%) and 22 above their 50-day averages (78.6%). These measure short- and medium-term participation in the sector sample, with a different universe and horizon from broad-market 200DMA breadth.[1]
SMH's 20-day return exceeded SPY's by 4.25 percentage points and QQQ's by 1.03 percentage points. Relative advantage remained, but semiconductor ETFs generally declined over five days while SPY gained 1.16% and QQQ gained 0.23%. The recent week's relative performance therefore differs from the longer window.[1][2]
Crowding/heat was 69.0, Elevated, below the prior published 81.5 but not back to a low-risk state. Divergence fragility was 52.5, Contained. Weaker trend support, cooler heat and residual elevated risks can coexist. Sector cooling should not be equated with the disappearance of every risk.[1]
Sector internals: leadership and supply-chain performance differ
Over 20 trading days, monitored AI accelerators gained an average 7.98%, servers and networking gained 7.39%, foundry and equipment gained 6.36%, and analog/MCU/power gained 2.89%. Memory and storage fell 3.78%. Strength exists across multiple parts of the chain, but participation is uneven.[1]
Over five days, servers and networking still gained 0.64% on average; all four other groups declined. AI accelerators fell 3.31%, foundry and equipment 6.11%, analog/MCU/power 6.19%, and memory/storage 5.46%. Cooling is more evident in this short window than in cumulative 20-day returns.[1]
HPE, AMD and MRVL led the monitored universe over 20 days, gaining approximately 18.3%, 17.8% and 16.6%. This is a ranking of observed price changes, not a buy list. The difference between leaders and other stocks should be considered with breadth, supply-chain confirmation and risk heat.[1]
If relative returns stay positive while breadth contracts and supply-chain confirmation weakens, sector strength may depend increasingly on a few leaders. Renewed participation across more groups, with controlled heat, would provide broader support for a Constructive reading. These are observation conditions, not predictions for next week.[1]
Long-term rates: the start date changes the dominant contribution
The New York Fed ACM source is available through October 8. The 10-year fitted yield was 5.217%, comprising an expected-average-short-rate component of 4.297% and a term premium of 0.920%. The components sum to the fitted yield. This is a model decomposition, not a traded Treasury yield quote.[1][3]
Across 21 observation intervals, September 9 to October 8, the fitted yield rose 39.48 basis points: 17.84 bp from expected rates and 21.64 bp from the term premium. In that window, rising term compensation contributed more, so long-end pressure cannot be attributed exclusively to policy-rate expectations.[1][3]
The calendar-month window starts September 8: the total increase was 39.63 bp, comprising 23.23 bp from expected rates and 16.40 bp from the premium. Moving the start date back one observation changes the dominant component. Short-window term compensation pressure cannot be generalized to the calendar month or every horizon; comparisons must preserve their dates.[1][3]
Over three months, six months and one year, expected-rate contributions were 31.55, 59.89 and 71.51 bp, respectively, exceeding the corresponding premium contributions. Rising long-end rates remain a valuation constraint, with window-dependent drivers. This decomposition is neither a forecast of the next FOMC decision nor a standalone explanation of equity prices.[1][3]
Next observations: wait for a complete signal and seek joint confirmation
The October 9 weekly risk signal remains PENDING_DATA. The high-yield spread input BAMLH0A0HYM2 currently ends October 8, short of the required Friday observation. A successful refresh request does not mean the week's inputs are complete. No additional assessment of missing October 9 credit-market changes is made here.[1][5]
Displayed Level 4 / 90% retains the complete October 2 signal, effective October 5. Whether the new October 9 week maintains or changes that level cannot be established until credit data is complete and calculations are finished. Higher reference exposure coexisting with a Defensive composite reflects different model emphases and requires cross-checking participation and fragility.[1]
A more positive research assessment requires joint confirmation: lower composite risk alongside easing participation risk and fragility, improved daily moving-average breadth with stable coverage, and AI hardware relative strength supported by more groups. Renewed composite increases, narrower breadth or a wider sector pullback would support retaining the Defensive assessment.[1]
Rates and credit provide separate checks. Track which component drives long-end yield changes using consistent windows, and wait for the missing high-yield observation before assessing alignment with other stress indicators. A single score, strong stock or threshold crossing does not substitute for these checks.
Data, methodology, versions and disclosure
Published October 10, 2026. Equity and composite observations mainly run through October 9. ACM and high-yield spread observations end October 8; NFCI/ANFCI and the retained weekly signal end October 2; monthly breadth and long-short crowding end September 30; beta-adjusted long-only crowding ends August 31.[1]
The existing composite model uses four equally weighted pillars based on prior-only five-year rolling percentiles after sufficient history. Ranges are below 35 Constructive, 35 to below 50 Neutral, 50 to below 65 Caution, 65 to below 80 Defensive, and 80 or above Stress. These are not crisis probabilities. AI hardware uses a separate model, so its score is not the same risk scale.[1]
Price changes use dashboard adjusted-price inputs; dividend-reinvestment returns were not independently reconstructed, and results are not strategy performance. Breadth uses the Massive extension with historical ticker seeds, not official current CRSP coverage; eligible samples and denominators vary. The AI universe contains 28 monitored stocks, not the entire sector. Crowding variants are not interchangeable.[1][2]
The standalone WQS card labeled October 31 is not treated as a realized current observation. The exported composite is retained without re-estimation. Revisions, pending data and different windows are identified separately. Cover mountains are brand imagery; report charts use frozen inputs.[1]
Prepared by Residual Inertia | 余势, author Taiyang Feng (Sunny), for independent research and information sharing. This is not investment or securities-trading advice. Model reference exposure is not actual holdings; the report does not provide the author's holdings or conflicts of interest. Historical results and model states do not guarantee future outcomes.
Report chart data
Composite pillars
| Pillar | Score | State |
|---|---|---|
| Financial Stress | 40.0 | Neutral |
| Fragility | 94.1 | Stress |
| Market Risk | 54.5 | Caution |
| Participation | 74.8 | Defensive |
ETF price changes through October 9
| ETF | Five days | Twenty days |
|---|---|---|
| QQQ | +0.23% | +5.09% |
| SMH | -4.32% | +6.12% |
| SOXQ | -4.33% | +6.26% |
| SOXX | -5.01% | +6.13% |
| SPY | +1.16% | +1.87% |
| XSD | -4.91% | +4.42% |
AI hardware groups
| Group | Sample size | Five-day mean | Twenty-day mean |
|---|---|---|---|
| AI Accelerators | 5 | -3.31% | +7.98% |
| Servers & Networking | 5 | +0.64% | +7.39% |
| Foundry & Equipment | 7 | -6.11% | +6.36% |
| Analog, MCU & Power | 8 | -6.19% | +2.89% |
| Memory & Storage | 3 | -5.46% | -3.78% |
ACM contributions ending October 8, 2026
| Start | Expected rates bp | Term premium bp | Total bp |
|---|---|---|---|
| 2026-09-09 | +17.84 | +21.64 | +39.48 |
| 2026-09-08 | +23.23 | +16.40 | +39.63 |
| 2026-07-08 | +31.55 | +27.77 | +59.31 |
| 2026-04-08 | +59.89 | +27.87 | +87.76 |
| 2025-10-08 | +71.51 | +31.46 | +102.96 |
Sources & Limitations
Frozen dashboard outputs, same-vintage model history and New York Fed ACM data. The public data attachment contains research fields only. Observation dates, historical revisions and missing data are stated in the text.
- [1] Public frozen report inputs
- [2] Massive adjusted-price methodology
- [3] New York Fed ACM Treasury Term Premia
- [4] Chicago Fed NFCI/ANFCI methodology
- [5] FRED high-yield spread input
For research purposes only. Not investment advice. Past performance does not guarantee future results.