
Our view
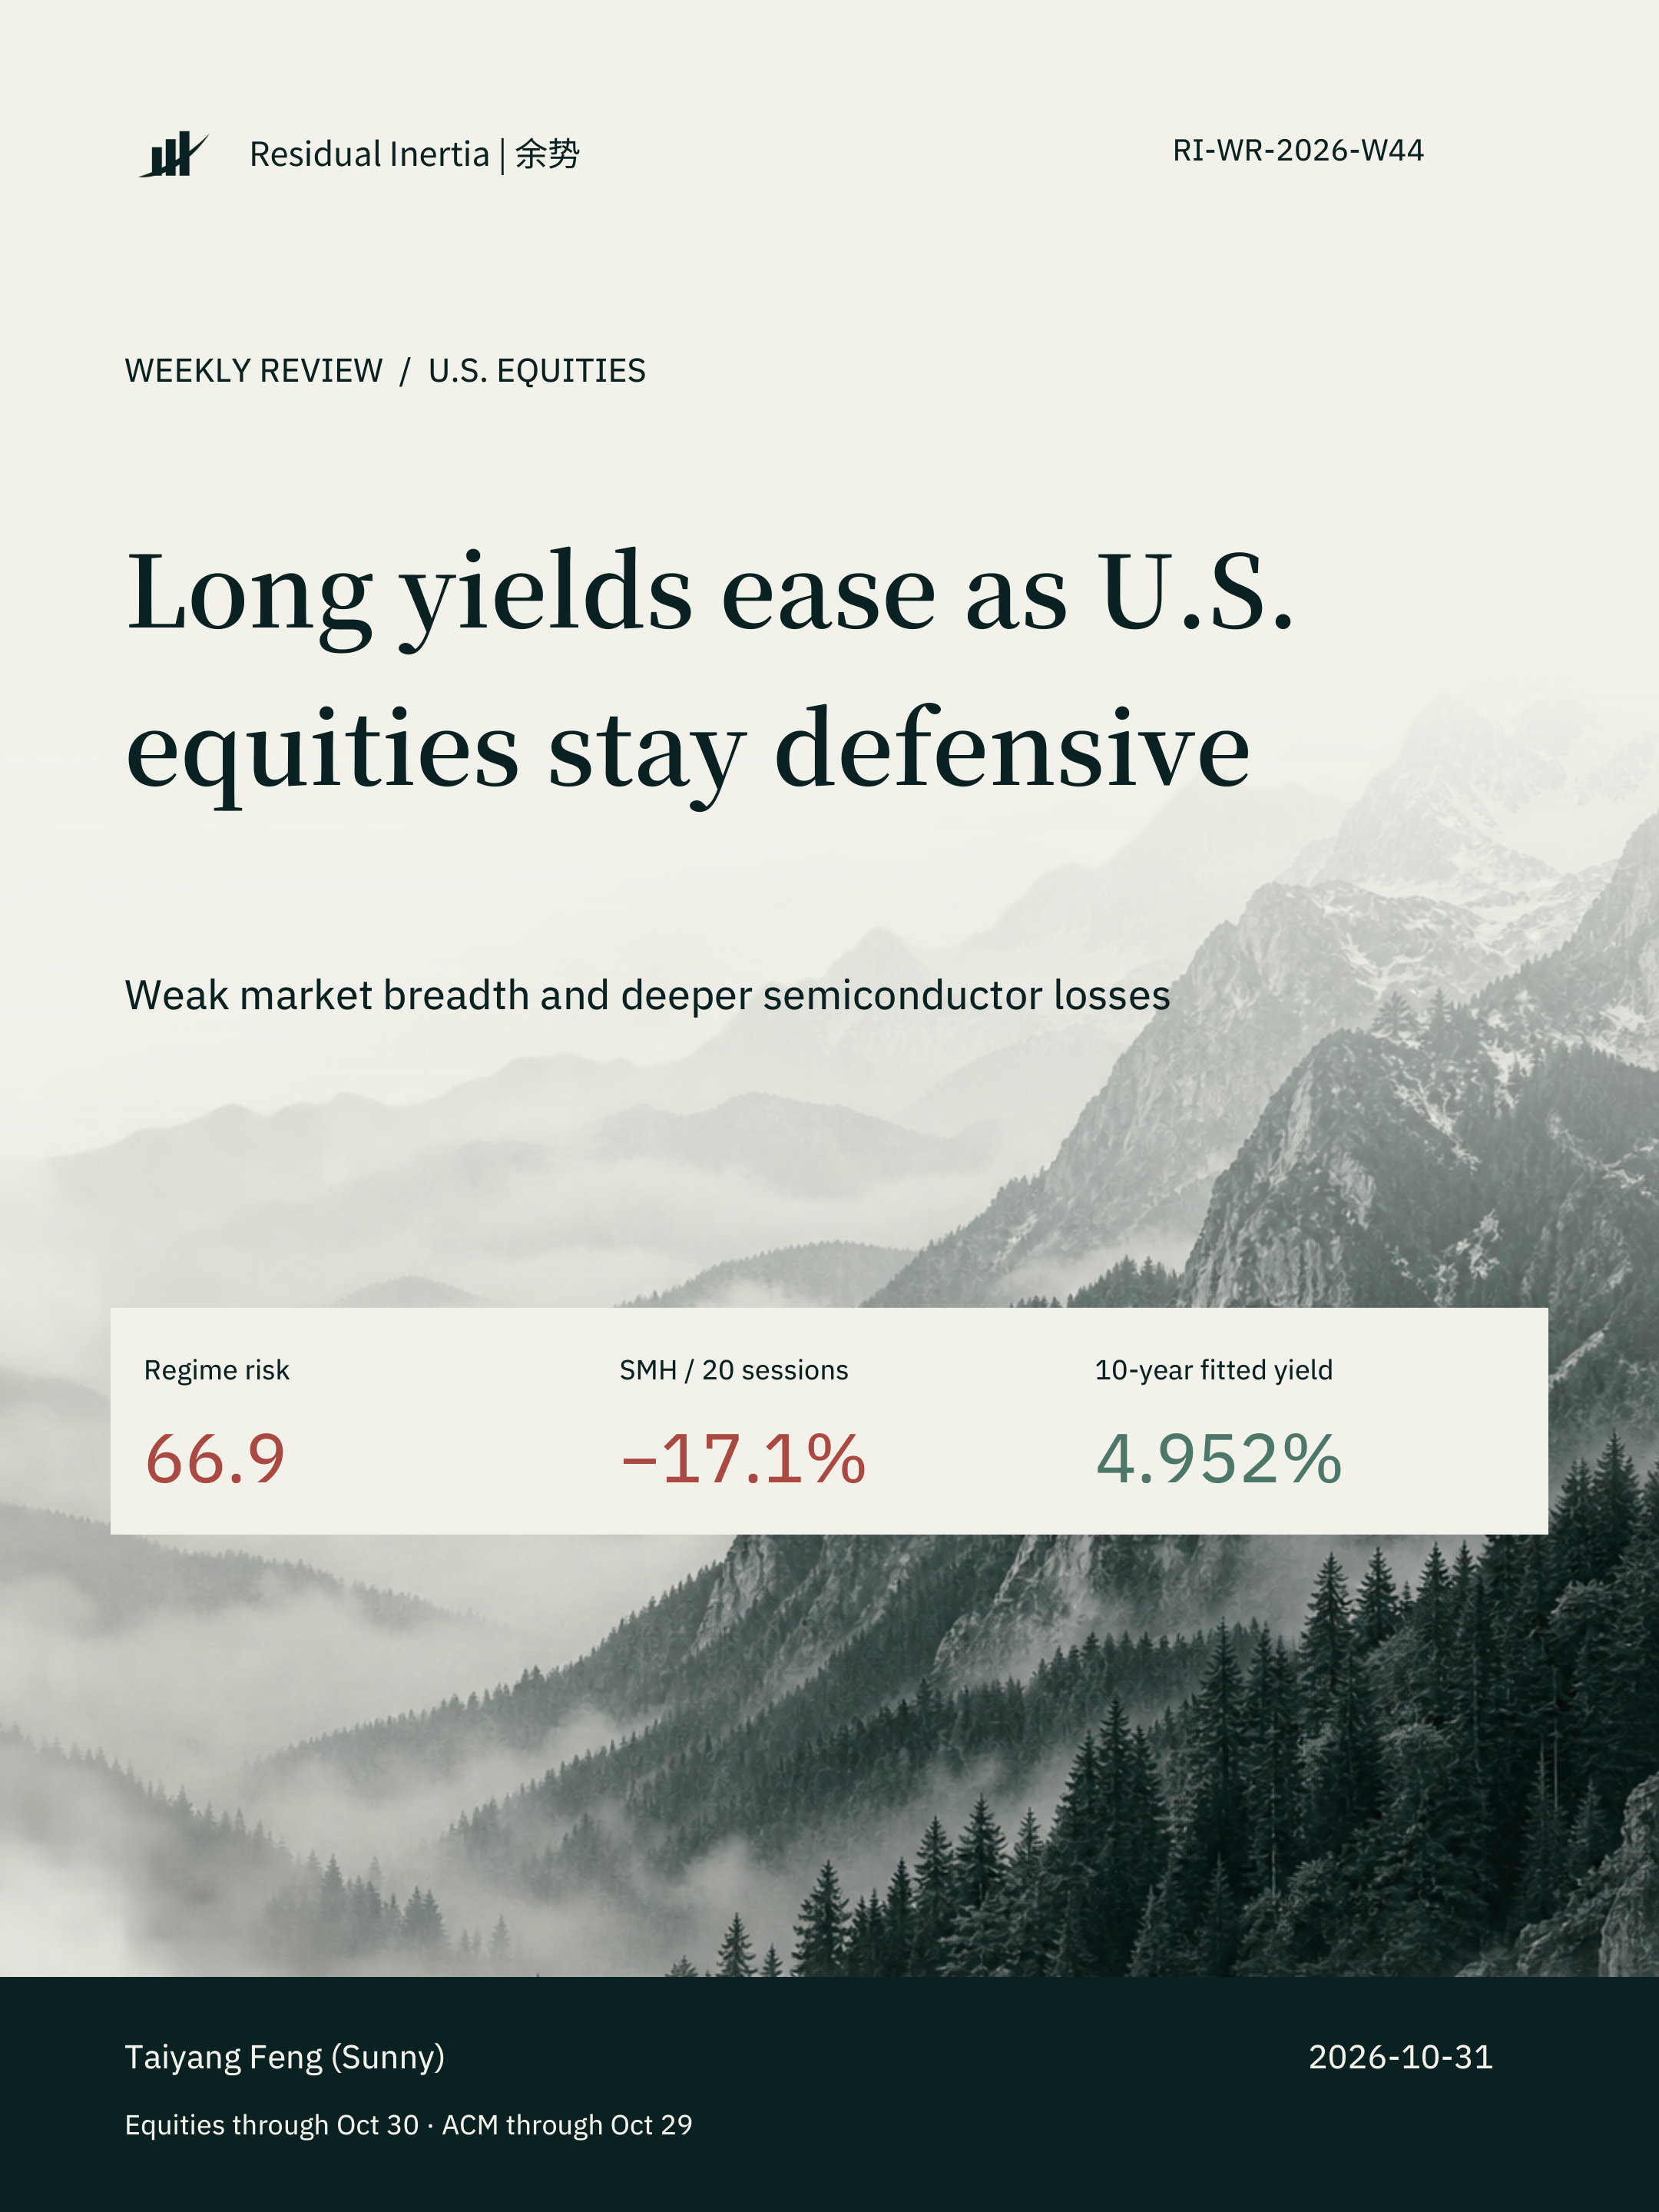
On October 30, the composite regime risk score stood at 66.9, in Defensive territory. Market risk reached 68.3 (Defensive), while participation risk was 61.8 (Caution). Financial stress remained Neutral at 49.0. Fragility was the outlier at 88.6, in the Stress range. Long yields eased over the month, while equity breadth and momentum gave little evidence of a comparable recovery. The research stance remains defensive, with exposure to crowded themes and semiconductors kept in check.
Author: Taiyang Feng
Report ID: RI-WR-2026-W44 · v1.0
Breadth contributes most to risk
On October 30, the composite regime risk score stood at 66.9, in Defensive territory. Market risk reached 68.3 (Defensive), while participation risk was 61.8 (Caution). Financial stress remained Neutral at 49.0. Fragility was the outlier at 88.6, in the Stress range.
Market breadth made the largest contribution to the composite. Factor crowding and the bubble factor layer also contributed materially. When leadership rests on a narrow group of stocks exposed to common factors, fewer names can cushion a simultaneous selloff. That vulnerability supports a defensive equity stance even with neutral financial stress.
The October 30 reading is provisional. The model uses an October 30 HML valuation, retains a proxy for UMD, and takes other inputs at their latest eligible dates.
Semiconductor losses deepen
SMH fell 17.1% over 20 trading sessions, trailing QQQ by 9.3 percentage points. The semiconductor and AI hardware score stayed at its floor of zero. Its raw reading fell to −12.7, capturing further deterioration below the displayed floor.
Only 14% of the 28 monitored stocks traded above their 20-day moving average. The share above the 50-day average was also 14%. Demand momentum and supply-chain confirmation both scored zero, leadership breadth was 11 and relative risk appetite was 9. Resilience in a few names has yet to spread through the industry.
NXPI gained 6.5% and TXN gained 2.4% over the same window. INTC fell 44.9%, TER 38.9% and COHR 37.6%. Divergence fragility reached 82. Evidence of a durable turn would include more stocks reclaiming their moving averages and participation across equipment, memory and networking hardware.
A smaller term premium drives the yield decline
The ACM fitted 10-year Treasury yield was 4.952% on October 29. Its expected short-rate component was 4.287% and its term premium was 0.664%. From September 29 to October 29, the fitted yield fell 27.30 basis points.
The term premium accounted for 17.94 basis points of the decline, roughly two-thirds of the total. Expected short rates contributed a further 9.37 basis points. Both components fell, with the larger adjustment coming from the compensation investors required to hold longer-dated debt. Displayed components are rounded.
The fitted yield was still 21.41 basis points above its level three months earlier, 48.30 above six months earlier and 83.39 above a year earlier. Expected rates accounted for 67.07 basis points of the annual increase. The monthly decline eases valuation pressure, but the rate backdrop remains tighter than a year ago.
What would justify more equity risk?
Long yields eased over the month, while equity breadth and momentum gave little evidence of a comparable recovery. The research stance remains defensive, with exposure to crowded themes and semiconductors kept in check.
Two developments would support taking more risk: sustained improvement in participation that reduces the risk contribution from breadth, and a recovery in semiconductors relative to QQQ backed by stronger demand momentum and supply-chain confirmation. A short-lived rally in a few leaders or a decline in yields alone would leave the allocation case largely unchanged.
Sources & Limitations
Sources: RI U.S. Market Research Dashboard and ACM rates monitor. The regime reading uses estimated inputs and is provisional.
For research purposes only. Not investment advice. Past performance does not guarantee future results.