
Our view
The semiconductor and AI hardware composite has fallen to 0 / Weak, and SMH lost 13.1% over 20 trading sessions. The weekly risk model remains at Level 5 with 35% reference risk exposure. The research stance stays defensive, awaiting joint improvement in breadth and industry momentum before taking more risk.
Author: Taiyang Feng
Report ID: RI-WR-2026-W43 · v1.0
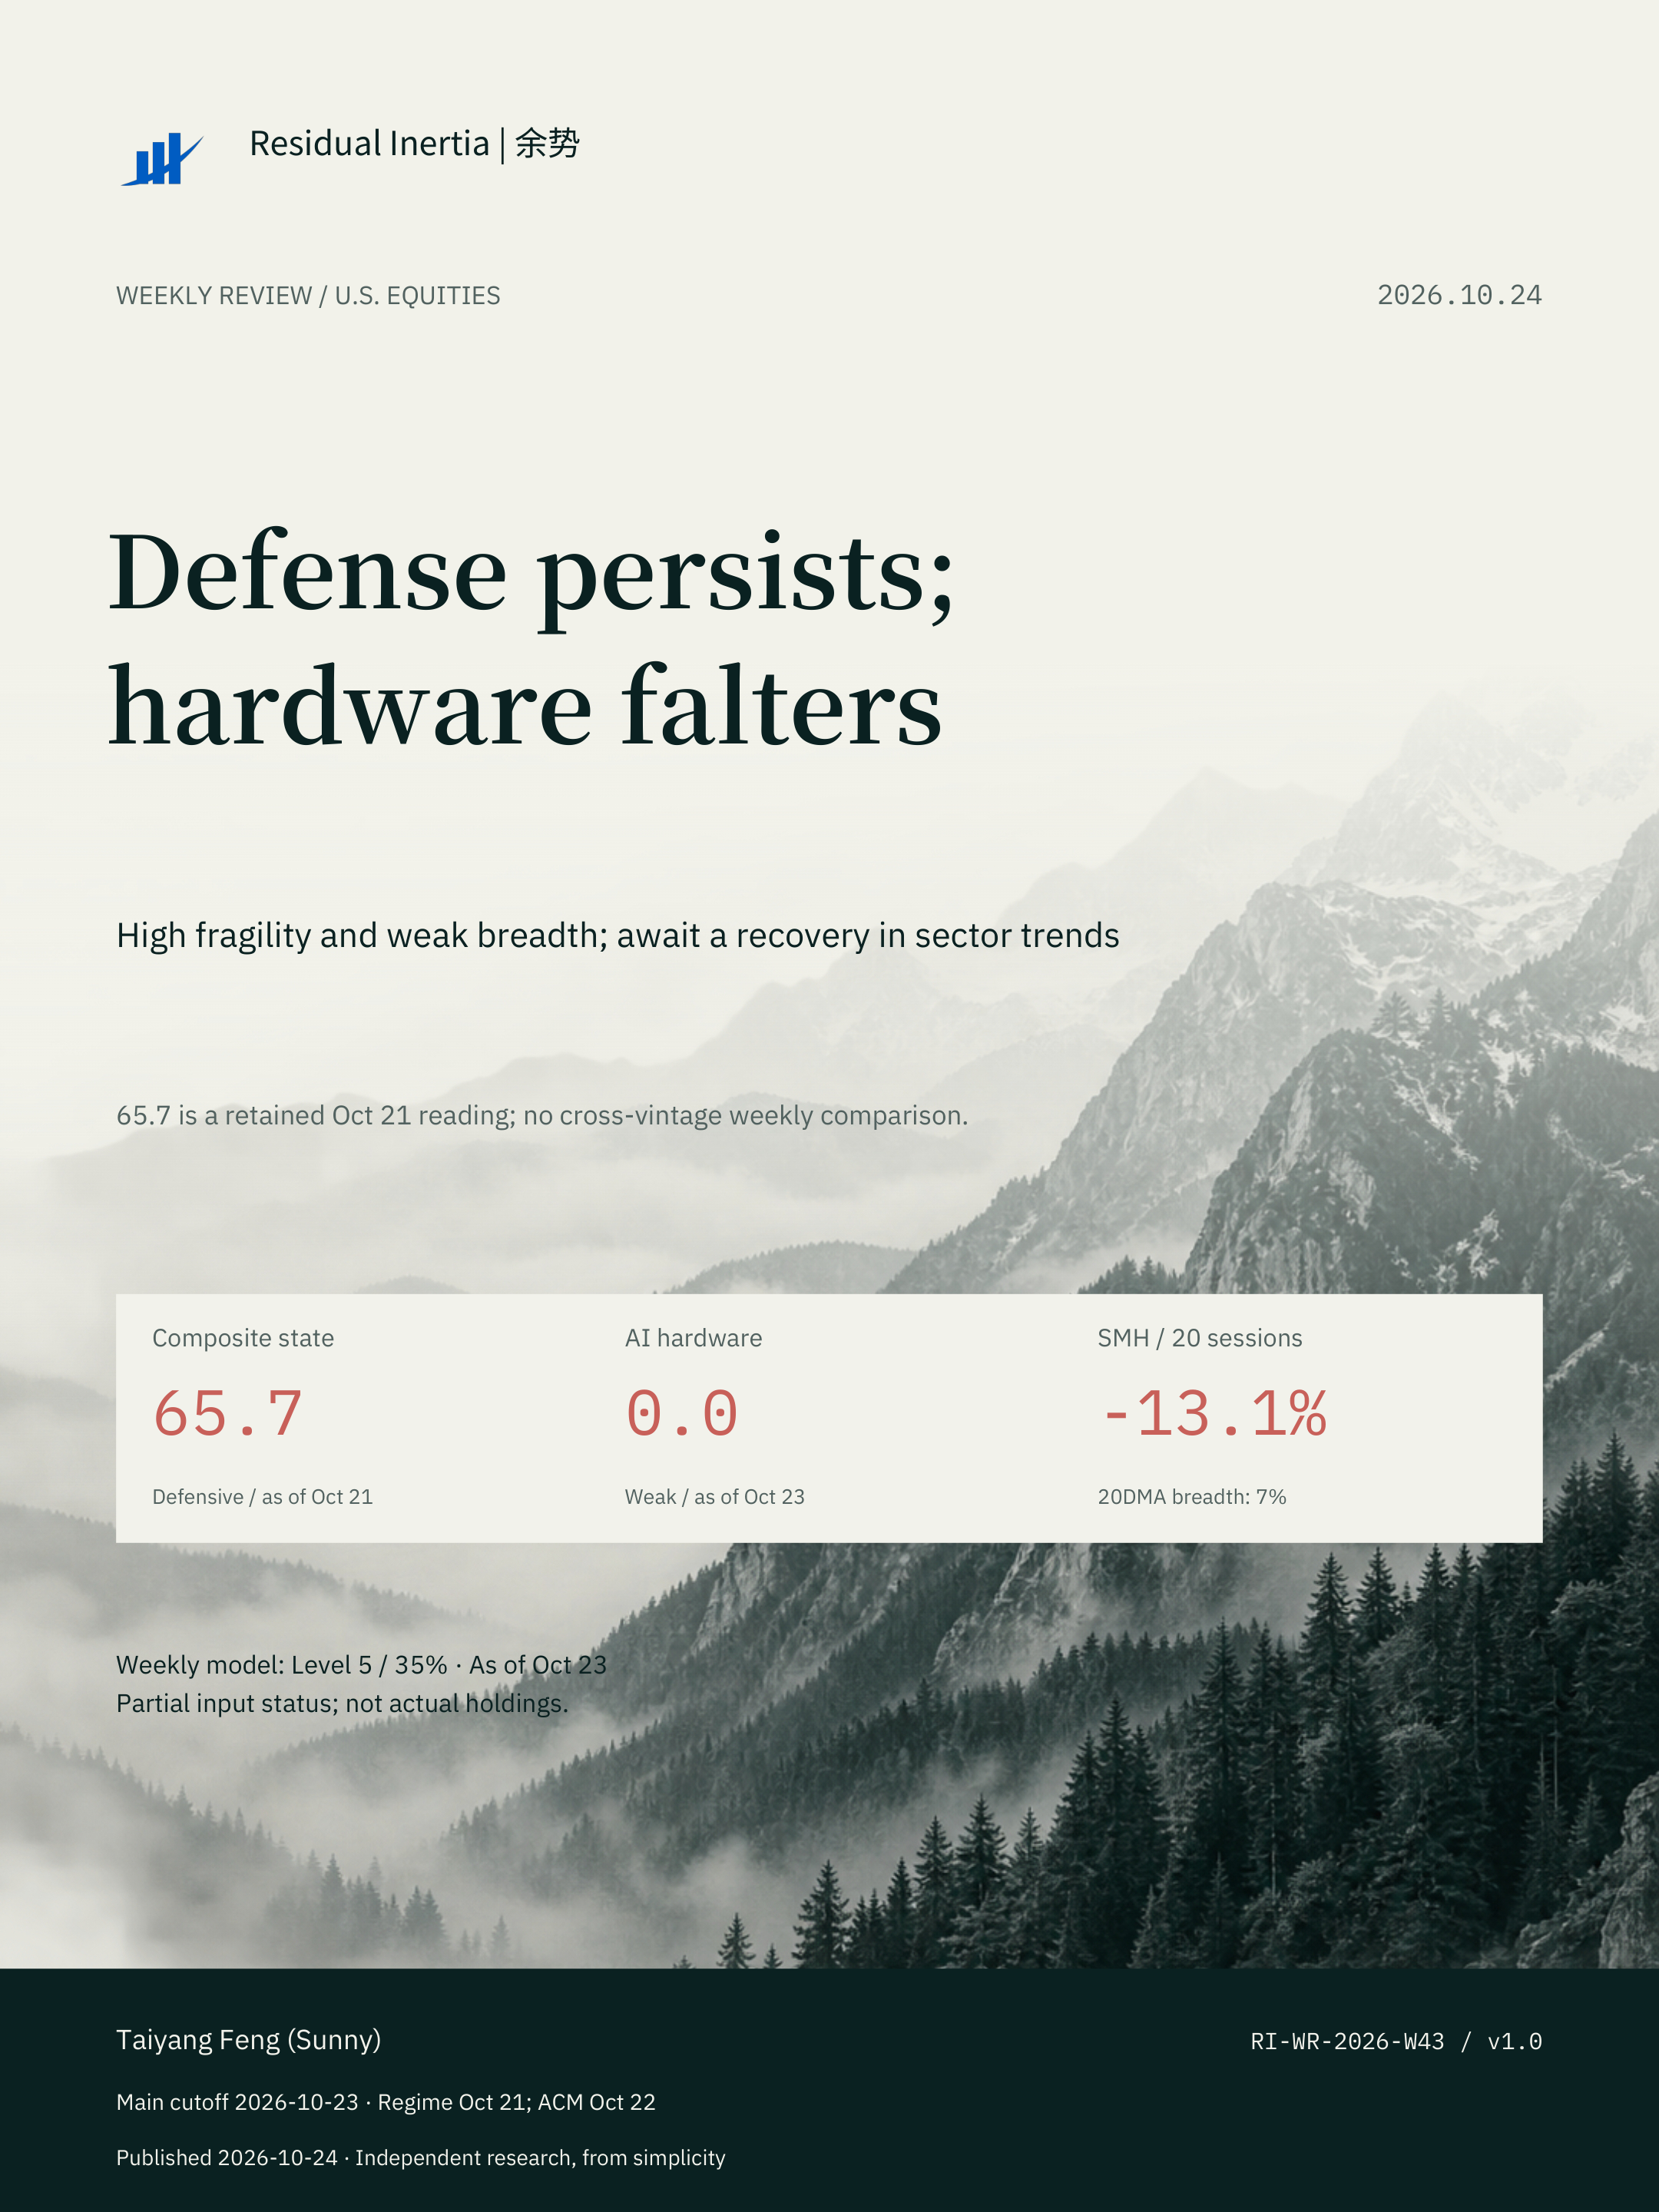
Defense persists; hardware loses momentum
For the observation window ending October 23, the U.S. equity composite remains Defensive. The latest available Regime Risk Score is 65.7, observed on October 21; it is not a complete October 23 recalculation. Some sources remain pending. This edition focuses on risk structure rather than short-term score changes.
Market Risk at 62.8, Participation risk at 56.5 and Financial Stress at 51.8 are all in Caution, while Fragility stands at 92.0. The concern extends beyond a single price indicator: weak participation, elevated structural fragility and damaged sector leadership coexist.
The semiconductor and AI hardware composite has fallen to 0 / Weak, and SMH lost 13.1% over 20 trading sessions. The weekly risk model remains at Level 5 with 35% reference risk exposure. The research stance stays defensive, awaiting joint improvement in breadth and industry momentum before taking more risk.
After the revision, read the risk structure
HML data-coverage rules changed this week, while the retained UMD proxy methodology continues. The current composite uses estimated inputs: HML estimates are restricted to dates passing coverage gates, rather than a fully certified formation-period or point-in-time dataset. The new and old scores are not strictly comparable; the difference between 65.7 and last edition's 58.1 cannot all be attributed to market deterioration.
Fragility is substantially higher than the other three pillars. Its 92.0 reading is a standardized model risk score, not a probability of a decline. Financial Stress at 51.8 should also be read alongside independently dated financial-conditions observations; a state label alone does not establish a systemic crisis.
Model weights and the weekly exposure rules were not changed by this source-rule revision. Missing factor dates are not forward-filled, and unavailable inputs remain pending. Score changes should be assessed only within a consistent methodology and adequately covered series.
Breadth and factors: crowding is not valuation
The home dashboard shows approximately 40.0% market breadth for the official end-September monthly observation, not an October 23 daily measurement. Separate source and nowcast dates do not replace that official period. This report retains the monthly label and does not join differently defined or differently sampled breadth measures into one trend.
The factor-crowding module shows 0.758 / L3 for the long-short specification and 0.872 / L4 for the beta-adjusted long-only specification, both observed at end-August. These remain signals of concentration and common-unwind risk, but they should not be described as a new jump in crowding this week.
The valuation layer places HML around its 96th percentile, which the dashboard interprets as relatively cheaper value, not “96% crowding.” UMD is around its 28th percentile and has a different direction. NFCI minus ANFCI is 0.022, observed October 16. Definitions and lags must be preserved rather than treating all readings as simultaneous risk confirmation.
AI hardware: a low score is not low risk
As of October 23, AI hardware is at 0 / Weak. Its raw score of approximately -3.8 is clipped to the display floor of zero. This means weak trend support, not zero risk; the score direction is opposite to that of the broad market risk model.
Demand momentum and supply-chain confirmation both display zero, with leadership breadth around 7 and relative risk appetite around 16. Weakness across several pillars provides little basis for declaring a sector recovery solely from rebounds in a few stocks.
Among 28 monitored stocks, roughly 7% are above their 20-day moving average and 11% above their 50-day average. These are short- and medium-term participation measures, not 200-day breadth. Sector heat is around 34 while divergence fragility is around 77: cooling prices and elevated internal dispersion can coexist.
Sector internals: absolute and relative weakness
SMH declined 13.1% over 20 trading sessions and underperformed QQQ by about 7.7 percentage points. The sector has suffered both an absolute drawdown and relative weakness. These are dashboard adjusted-price window changes, not an independently reconstructed total-return series.
Within the same monitored universe, TXN, ADI and NXPI changed approximately +2.4%, -0.6% and -1.3% over 20 sessions. At the weak end, ARM, STX and INTC declined about 32.2%, 31.2% and 29.3%. Ranking near the top does not imply broad gains or durable sector leadership.
A recovery should be tested through broader participation: more stocks reclaiming their moving averages, demand and supply-chain confirmation improving from low levels, and relative performance stabilizing. With divergence fragility still elevated, isolated rebounds are insufficient. Findings from a fixed 28-stock universe should not be generalized to the entire technology sector.
Rates: little net change, offsetting forces
ACM observations end October 22. The fitted 10-year yield is 4.926%, comprising a 4.287% expected average short-rate component and a 0.639% term premium. This is a fitted model decomposition, not the actual traded Treasury yield for that day.
From September 22 to October 22, the fitted yield rose just 0.67 basis points: the expected-rate component contributed -6.03 bp and the term premium +6.70 bp. The two forces largely offset. A small net change does not mean unchanged components, and contribution shares based on a near-zero denominator would be misleading.
Cumulative changes over three months, six months and one year are +19.14, +58.56 and +91.01 bp, respectively; expected rates still dominate the longer windows. Marginal stability in rates alone does not offset weak equity breadth, damaged sector trends and elevated fragility.
Positioning lens: wait for joint improvement
The weekly risk model displays Level 5 / 35% for October 23, with a PARTIAL / FRESH status on the home dashboard. The 35% figure is model reference risk exposure, not the author's or any account's actual position. This report does not relabel partial inputs as complete data.
The defensive view rests on high fragility, limited participation and lost trend support in semiconductors and AI hardware. A zero sector score is not a mechanical bottom-fishing signal; a Defensive regime is not a prediction of an inevitable sharp decline. Models organize evidence rather than replace judgment.
Next, monitor whether estimated inputs and coverage are updated; whether broad participation improves; whether AI hardware breadth, demand and supply-chain confirmation recover together; and whether credit or rates add new pressure. Livermore S2 at 49.0 / Normal is a separate trend observation, not proof of systemic liquidity safety.
Data definitions, sources and disclosure
This edition is RI-WR-2026-W43, with a main observation cutoff of October 23, 2026, prepared and published October 24. Readings are frozen from the author-supplied commentary and four dashboard screenshots; models were not recalculated. Regime observations end October 21; ACM October 22; weekly risk and AI hardware October 23; financial conditions October 16. Monthly breadth and factor crowding carry separate lags.
Higher composite risk scores mean greater risk: below 35 is Constructive, 35 to below 50 Neutral, 50 to below 65 Caution, 65 to below 80 Defensive, and 80 or more Stress. Higher AI support-pillar scores mean stronger support, while higher heat and divergence scores mean greater risk. Missing values are not replaced with zeros.
Charts use the displayed precision verifiable in the screenshots and do not invent historical paths. Percent and percentage points are distinct; one basis point is 0.01 percentage point. Window totals and components may differ due to rounding. HML at 96% is a valuation percentile; AI breadth at 7% refers to the 20DMA. The future-dated WQS card is excluded as a current realized observation. Mountain imagery is decorative branding.
Prepared by Residual Inertia | 余势. Author: Taiyang Feng (Sunny). For independent research and information only; not investment or securities-trading advice. Model reference exposure is not an actual holding. Past performance and model states do not guarantee future outcomes.
Reference data
[Frozen observations for this edition](https://residualinertia.com/assets/papers/ri-weekly-2026-10-24-data.json)
Sources & Limitations
Displayed readings frozen from the author-supplied commentary and dashboard screenshots; no model recalculation. Estimated inputs, pending statuses and differing observation dates are retained.
For research purposes only. Not investment advice. Past performance does not guarantee future results.