
Our view
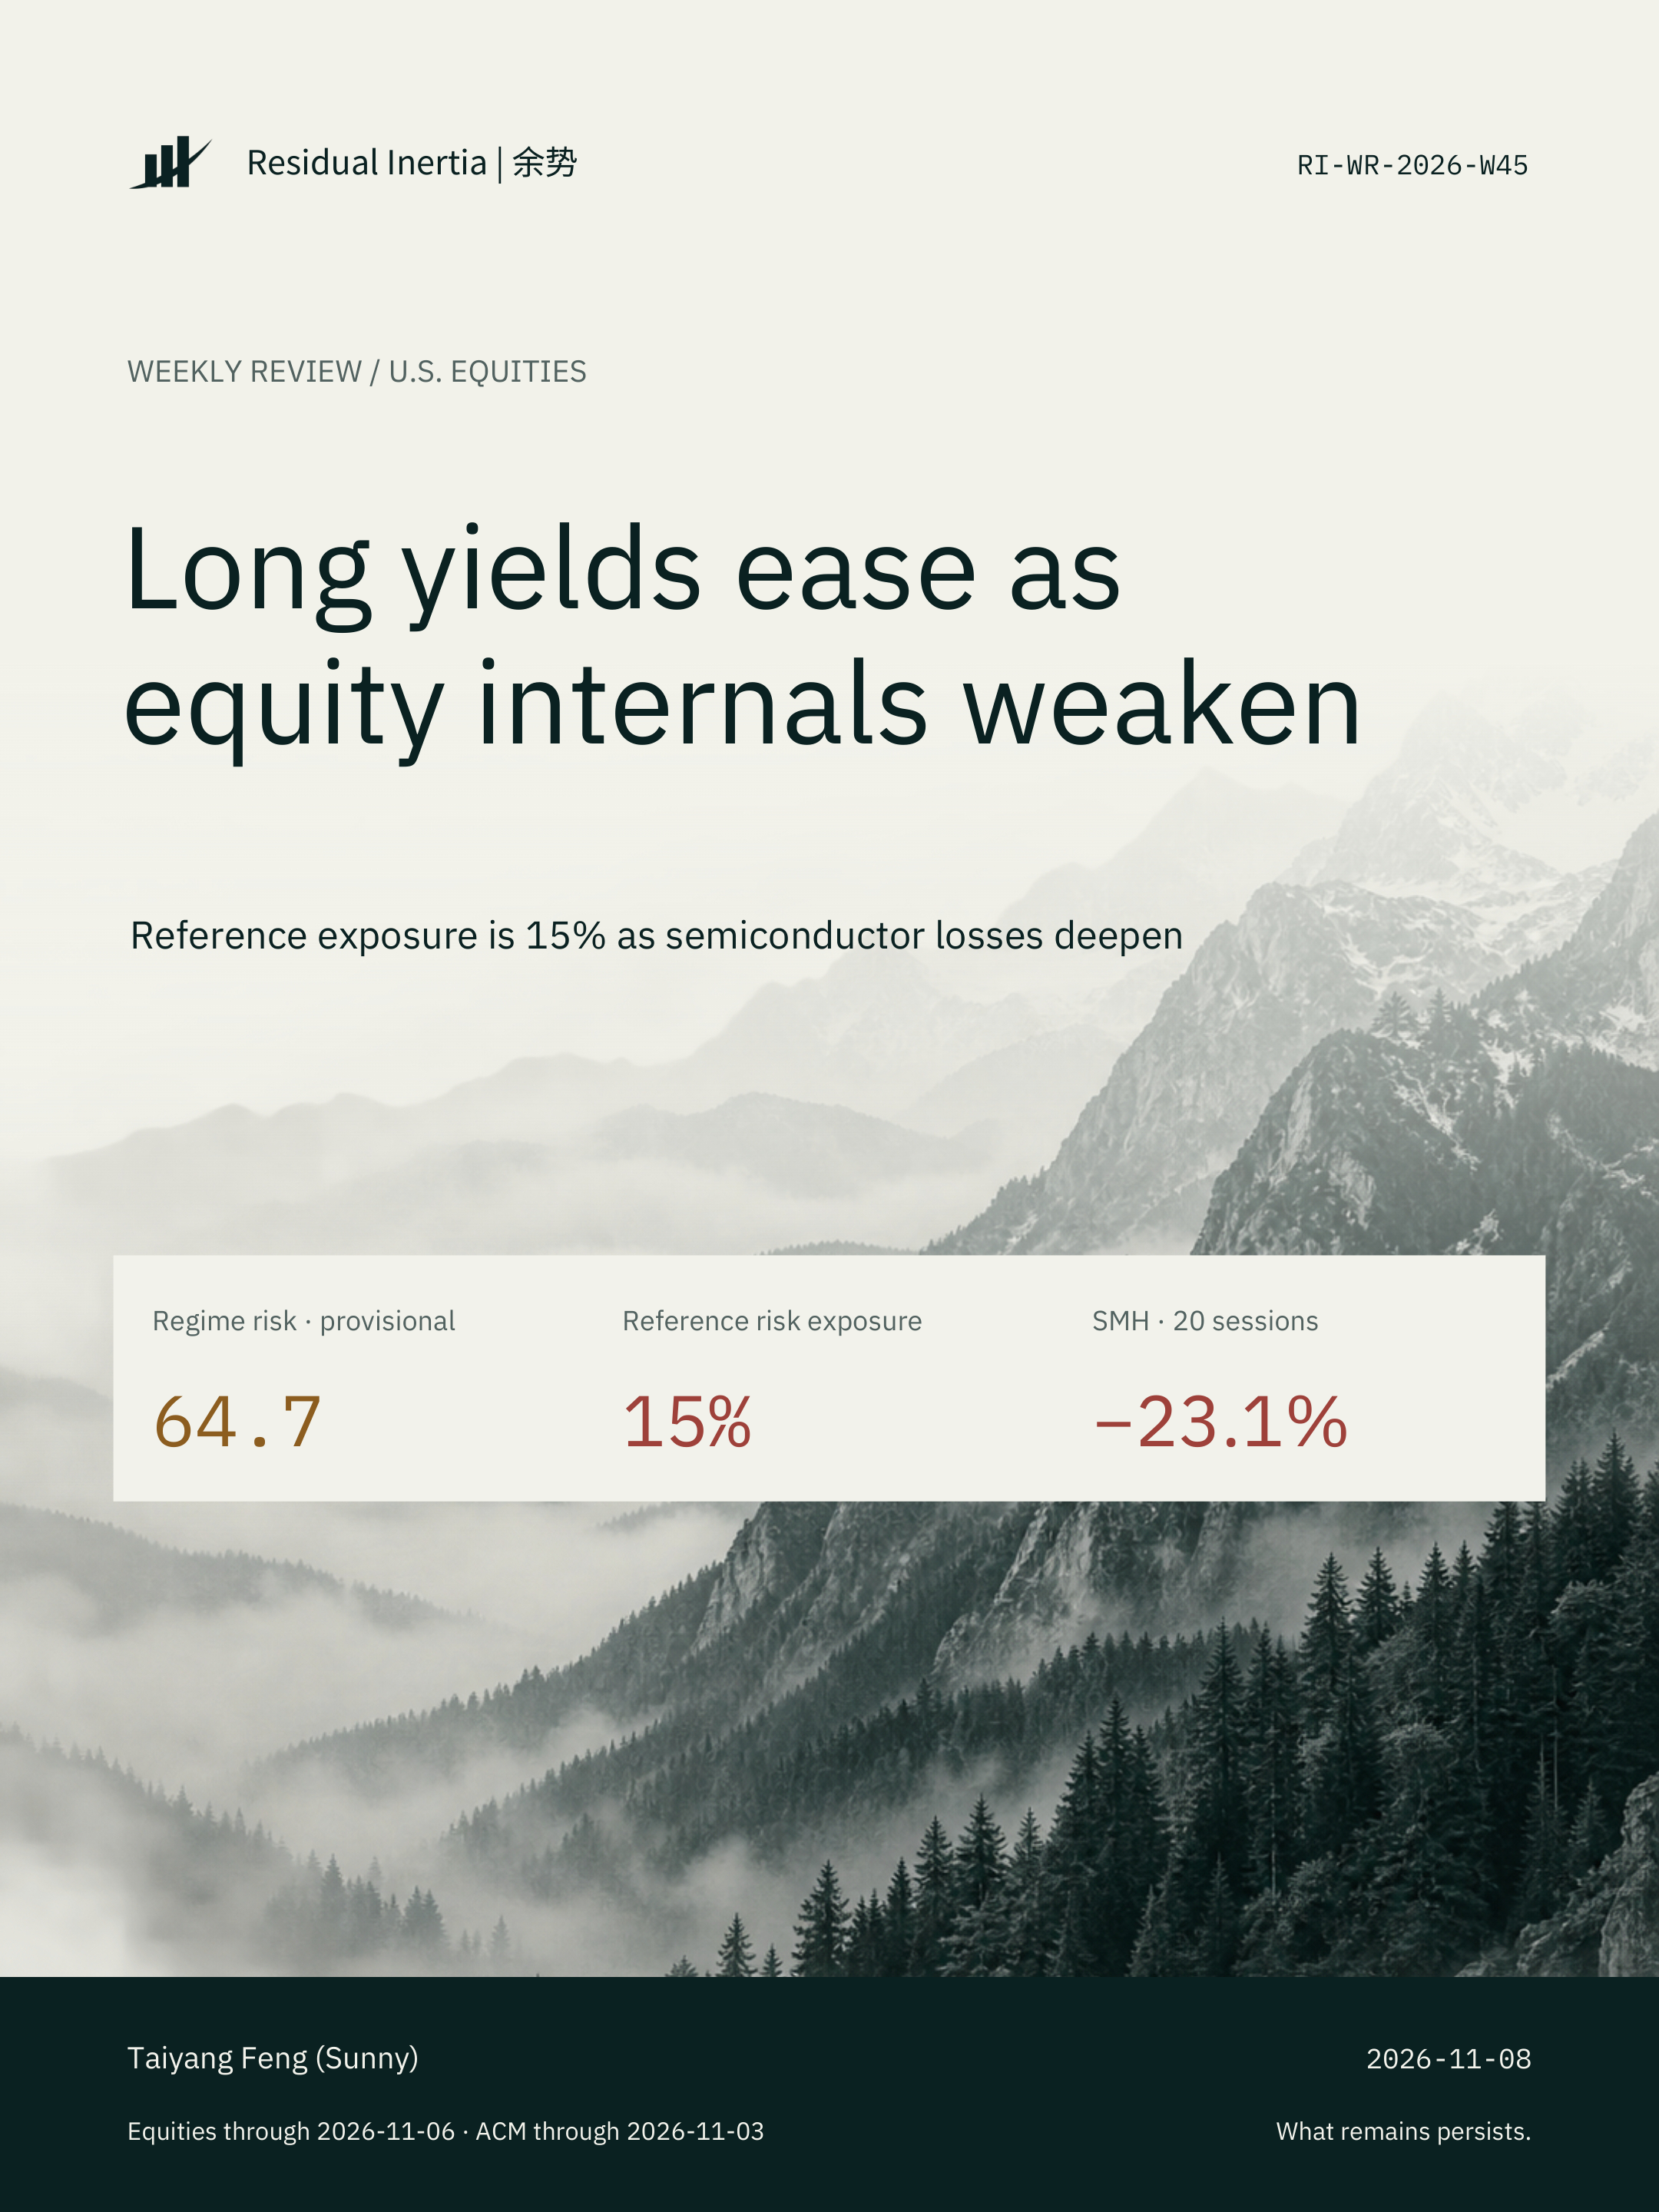
As of November 6, the provisional U.S. composite regime risk score was 64.7, in the Caution range. The weekly risk model indicates 15% reference exposure. Market risk and fragility were both in the Stress range, and semiconductors sharply lagged QQQ over 20 sessions. Lower long yields ease some valuation pressure. The research stance keeps exposure low while waiting for sustained improvement in market breadth and technology sector trends.
Author: Taiyang Feng
Report ID: RI-WR-2026-W45 · v1.0
Equity internals remain under stress
The U.S. composite regime risk score was 64.7 on November 6, in the Caution range. Market risk and fragility were both in Stress at 87.9 and 88.3. Participation risk was 54.1 (Caution), while financial stress remained Constructive at 28.5.
The research dashboard’s composite breadth reading was just 44.2%, the average of two October month-end breadth measures. The public November 6 daily nowcast put the share of stocks above their 200-day moving average at about 43.1%. At September month-end, long-short factor crowding was at L3 and beta-adjusted long-only crowding at L4. On November 6, the HML valuation measure in the bubble factor layer was near its 94th historical percentile, indicating unusually cheap valuations for the value leg relative to the growth leg. Livermore S2 entered Watch at 74.6, flagging the risk of upside exhaustion.
The Chicago Fed’s NFCI and ANFCI stood at −0.459 and −0.435 on October 30, a spread of −0.024. Both indices remained below zero and had risen over four weeks. Together with the financial stress reading, these measures point to pressure concentrated within equities and offer limited evidence of broad financial tightening.
Hardware weakens below the score floor
The semiconductor and AI hardware score remained at its floor of zero on November 6, but the raw reading fell from −12.7 in the prior edition to −34.2. SMH lost 23.1% over 20 sessions and trailed QQQ by about 10.4 percentage points. The raw score and relative return show deterioration below the displayed floor.
About 4% of the 28 monitored stocks traded above their 20-day moving average. The share above the 50-day average was also about 4%. Demand momentum and supply-chain confirmation both scored zero. Over the same 20 sessions, NXPI gained 9.1%, while MRVL, INTC and TER fell 48.7%, 46.2% and 45.8%, respectively. Strength in individual names has yet to spread through the sector.
A lower term premium leads the yield decline
On November 3, the New York Fed’s published ACM model put the fitted 10-year Treasury yield at 4.922%. The expected short-rate component was 4.244% and the term premium was 0.677%. The displayed levels are rounded.
From October 2 to November 3, the fitted yield fell 33.22 basis points. The term premium contributed −23.91 basis points, about 72% of the decline, while expected short rates contributed −9.31 basis points. The easing in long-rate valuation pressure mainly reflects a decline in the compensation investors required to hold longer-dated Treasuries.
Keep exposure low pending two signs of repair
The November 6 weekly risk signal indicates 15% reference exposure, effective November 9. The signal uses some lagged inputs. Lower long yields offer some valuation relief. The research stance keeps risk exposure low.
Before raising exposure, look for sustained gains in broad-market participation and stabilization in semiconductors relative to QQQ, backed by stronger demand momentum and supply-chain confirmation.
This week’s composite uses revised HML data coverage gates and estimation rules. It retains a proxy for UMD and uses the latest eligible data for other inputs. The provisional 64.7 reading cannot be compared directly with scores from earlier model versions. The 15% figure is a model reference. Actual holdings are tracked separately.
Sources & Limitations
RI U.S. Market Research Dashboard, Chicago Fed NFCI / ANFCI, and New York Fed ACM data. The composite regime risk score is provisional.
- [1] Frozen observations for this edition
- [2] RI U.S. market dashboard
- [3] Chicago Fed financial conditions indices
- [4] New York Fed ACM term premia
For research purposes only. Not investment advice. Past performance does not guarantee future results.